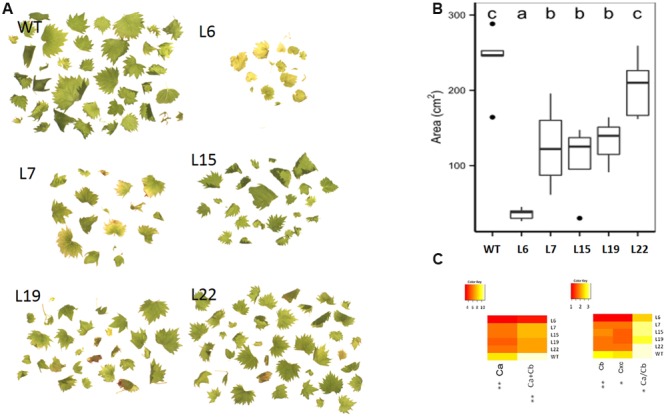
FIGURE 3.

Leaf area and color. (A) Leaves morphology, (B) leaves total area measured in cm2. (C) Heatmap representation for chlorophylls and total carotenoids. (∗) and (∗∗) respectively indicates significant differences (p < 0.05), and highly significant differences (p < 0.01). A legend with the color scale is reported on the top left part of each heatmap.
