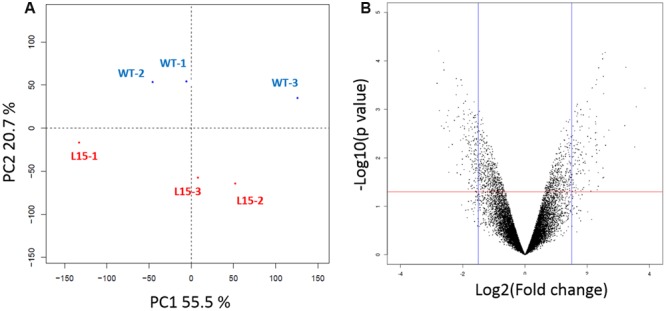
FIGURE 4.

RNA-Seq analysis of L15 line. (A) Classical multidimensional scaling showing the percentage of variance explicated by PC1 and PC2. (B) Volcano plot used for selection of differentially expressed genes (DEGs) between L15 and WT lines. Spots represent genes. The red line represents the significance threshold of p-value (0.05) and the blue lines represent log2 fold change values of 1.5 and -1.5. Genes located above the red line and on the right-hand side or the left-hand side of blue lines were selected as DEGs.
