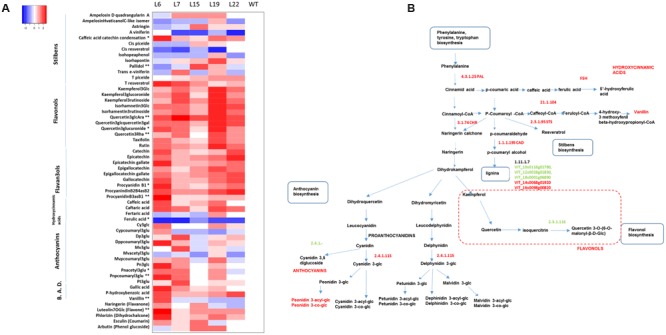
FIGURE 5.

Phenylpropanoid content in VviERF045 overexpressing lines. (A) Heatmap representation for phenylpropanoids content in the transgenic lines. For each metabolite, values are scaled by subtracting the WT mean value and dividing by the SD. (∗) and (∗∗) respectively indicates significant differences (p < 0.05), and highly significant differences (p < 0.01). A legend with the color scale is reported on the top left part. B.A.D., Benzoic acid derivative. (B) Transcripts involved in their biosynthesis. 4.3.1.25 Phenylalanine ammonium lyase (PAL) (VIT_16s0039g01170, VIT_16s0039g01240, VIT_16s0039g01280, VIT_16s0039g01300, VIT_16s0039g01360), 1.1.1.195 cinnamyl-alcohol dehydrogenase (CAD), (VIT_03s0110g00310, VIT_13s0064g00270), ferulate 5-hydroxylase (F5H) (VIT_17s0000g03930), 2.3.1.74 Chalcone reductase (CHR) (VIT_01s0011g06440), 21.1.104 Caffeoyl-CoA O-methyltransferase 1 (VIT_07s0031g00350), 1.11.1.7 peroxidase (VIT_12s0028g01830, VIT_14s0068g01920, VIT_10s0116g01780, VIT_18s0001g06890, VIT_16s0098g00820), 2.3.1.95 STS (stilbene synthase) (VviSTS2, VviSTS3, VviSTS5, VviSTS6, VviSTS7, VviSTS10, VviSTS13, VviSTS15, VviSTS17, VviSTS18, VviSTS19, VviSTST20, VviSTST21, VviSTST25, VviSTS25, VviSTS28, VviSTS29, VviSTS30, VviSTS31, VviSTST37, VviSTST38, VviSTST39, VviSTST42, VviSTS46, VviSTS47 (Vannozzi et al., 2012). 2.3.1.116 Quercetin 3-O-glucoside-6″-O-malonyltransferase (VIT_12s0134g00630). 2.4.1.115 anthocyanidin 3-O-glucosyltransferase (VIT_03s0017g02110, VIT_16s0022g01970), 2.4.1- UDP-glucose (VIT_18s0041g00830, VIT_18s0041g00840, VIT_18s0041g00930, VIT_18s0041g01010, VIT_16s0050g01680). Green color means down-regulated gene, red color up-regulation.
