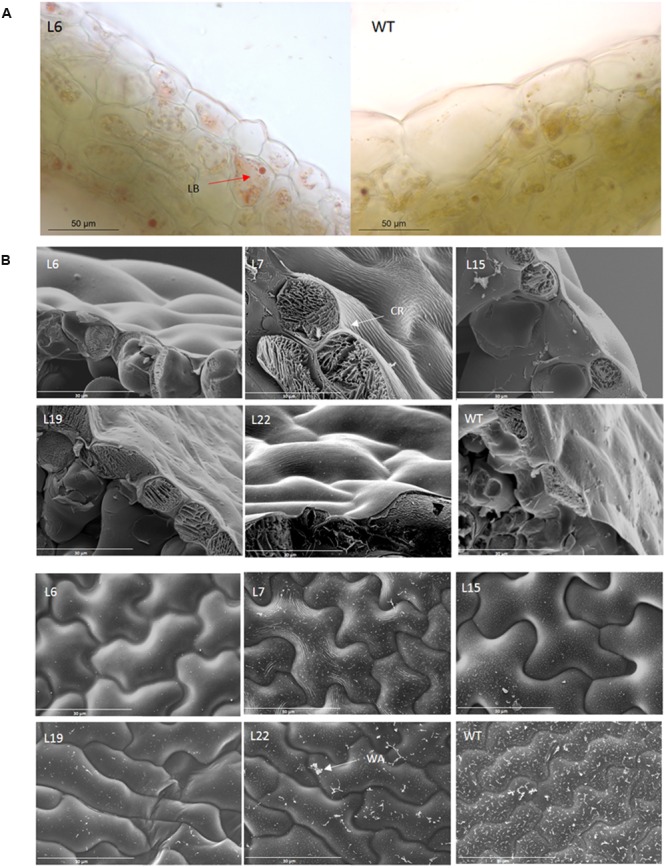
FIGURE 7.

Microscopic analysis of VviERF045 overexpressing lines. (A) Differences in lipids vesicle content in trangenic L6 and WT observed at 50X magnification and by SudanIV staining. LB, lipid bodies. (B) Changes in wax load and cuticle surface morphology of the transgenic lines detected by Scanning Electron Microscopy after freeze fracture (CryoSEM). Upper part: images of transversal section of the adaxial leaf surface. WT and L19 show wax deposition. (2000X) CR, Cuticular Ridge. Lower part: images of the adaxial leaf surface (1000X). WA, Wax Aggregates.
