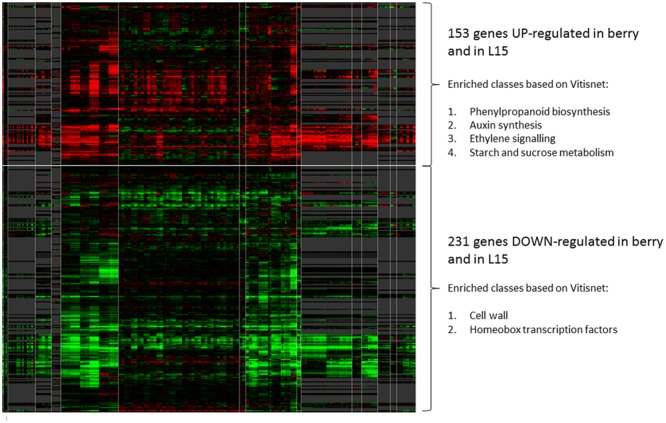
FIGURE 8.

Expression analysis of DEGs during berry ripening. Heatmap showing L15-DE genes modulated during berry ripening in 389 condition contrasts derived from 16 experiments relative to berry samples at different developmental stages, between EL 27 and EL 41. The heatmap was produced using the grapevine gene expression compendium VESPUCCI (http://vespucci.colombos.fmach.it/). Genes up-regulated or down-regulated in ripe berry are grouped respectively in the upper or lower part of the heatmap. The white vertical lines delimit the different experiments to which the selected contrasts belong. On the right, some enriched categories (Vitisnet) within the up- or down-regulated genes are listed.
