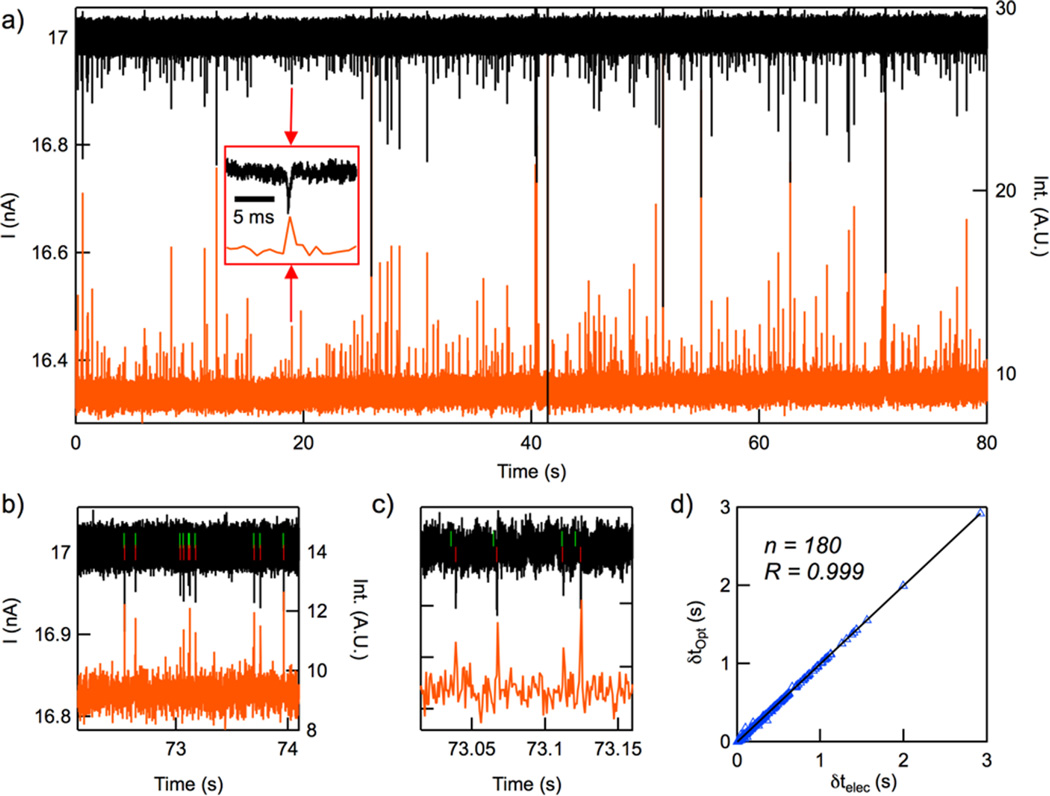
Figure 3.
(a–c) Traces of electrical (black) and optical (red) signals registered during the passage of fluorescent nanospheres through the nanochannel (Vapplied = −350 mV). The green and red ticks are associated with electrical and optical event beginning, respectively. (d) Correlation analysis of the delay time between successive optical δtOpt and electrical δtelec spikes.

