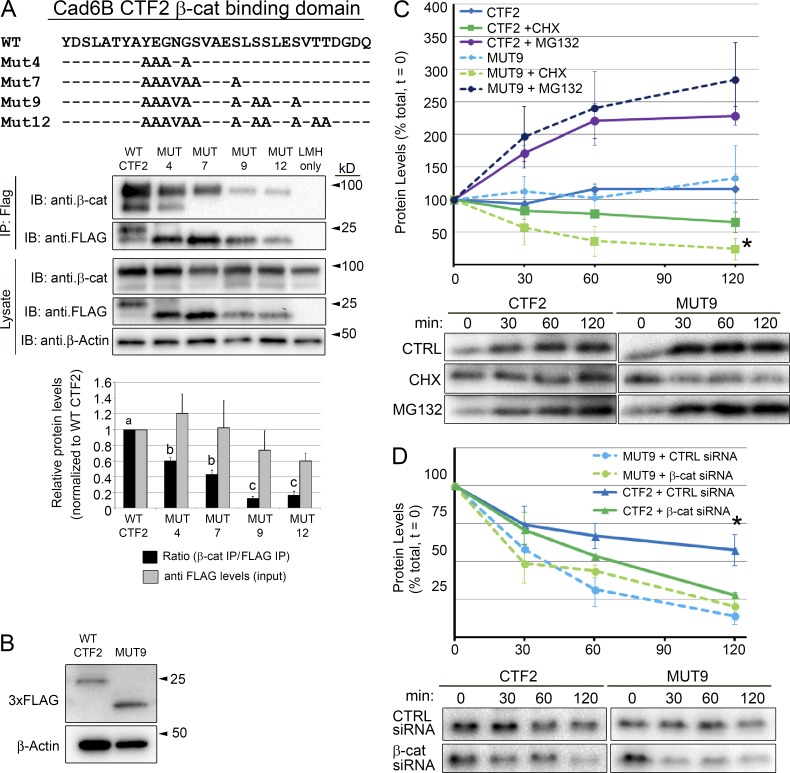
Figure 2.
Cad6B CTF2s are stabilized through β-catenin binding. (A) Cad6B CTF2 mutants were generated through alanine substitutions within the β-catenin minimal binding domain and at key adjacent phosphorylation sites. Black bars represent the ratio of coimmunoprecipitated β-catenin to immunoprecipitated (IP) mutant CTF2 levels normalized to the wild-type (WT) ratio (set at 100%); gray bars represent the input levels of mutant CTF2 protein (normalized to β-actin levels) relative to WT CTF2 input levels (set at 100%). Means that share letter superscripts are not significantly different (P < 0.05). Immunoblots are representative of three independent experiments. (B) Introduction of CTF2 or MUT9 reveals no change in expression levels in vivo. Embryos were electroporated with triple FLAG-tagged constructs and incubated for 5 h before electroporated neural tubes/neural crest cells were dissected out for immunoblotting. Each lane represents 20 pooled electroporated neural folds. (C) WT CTF2s exhibit decreased degradation rates compared with MUT9 proteins in vitro. FLP-In CHO cell lines expressing either CTF2-HA or MUT9-HA were treated with CHX or MG132 over a 2-h time course (n = 3). Asterisk denotes a significant difference in protein between CHX-treated CTF2 and MUT9 at 120 min. (D) Depletion of β-catenin corroborates dependence of CTF2, but not MUT9, on β-catenin binding for its stability. A validated DsiRNA (#3) to CHO cell β-catenin (Fig. S2 A) or negative control (CTRL) DsiRNA was transiently transfected into Flp-In-Cad6B-CTF2-HA or Flp-In-Cad6B-MUT9-HA CHO cells. CTF2 and MUT9 levels were analyzed after a 2-h CHX chase by immunoblotting (as in C). Asterisk denotes a significant difference in protein in negative control DsiRNA-treated CTF2-HA cells compared with β-catenin DsiRNA-treated CTF2-HA cells or DsiRNA-treated MUT9 cells at 120 min (n = 3, P < 0.05). Error bars in all panels indicate SEMs.

