Figure 3.
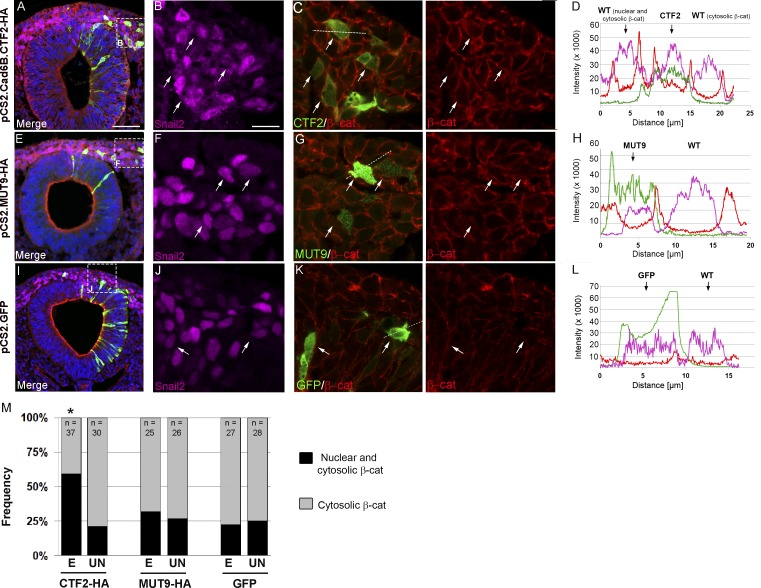
Cad6B CTF2 overexpression results in the redistribution and accumulation of β-catenin in cranial neural crest cells in vivo. Representative transverse sections taken through the midbrain region of 8–9ss embryos expressing CTF2-HA (A–C), MUT9-HA (E–G), or GFP (I–K), followed by immunostaining for Snail2 (purple), HA or GFP (green), and β-catenin (red). Boxes in lower-magnification (20×) merge images (A, E, and I) mark respective magnified (63×) areas (B, C, F, G, J, and K). (D, H, and L) Line scans showing subcellular fluorescent intensity of recombinant protein (green), β-catenin (red), and Snail2 (purple) across cell diameters (C, G, and K, dotted lines) from representative electroporated and adjacent unelectroporated cells. (M) Quantification of β-catenin levels in electroporated (E) and unelectroporated (UN) Snail2-positive neural crest cells reveals a statistically significant increase in the number of cells containing elevated nuclear and cytosolic β-catenin levels (black bars) versus cytosolic-only β-catenin (gray bars) in the presence of CTF2 but not MUT9 or GFP (*, P < 0.05). DAPI (blue) labels nuclei in A, E, and I. Bars: (A, E, and I) 50 µm; (B and all remaining images) 10 µm. Samples sizes (n) for each group are shown in M. WT, wild type.

