Figure 4.
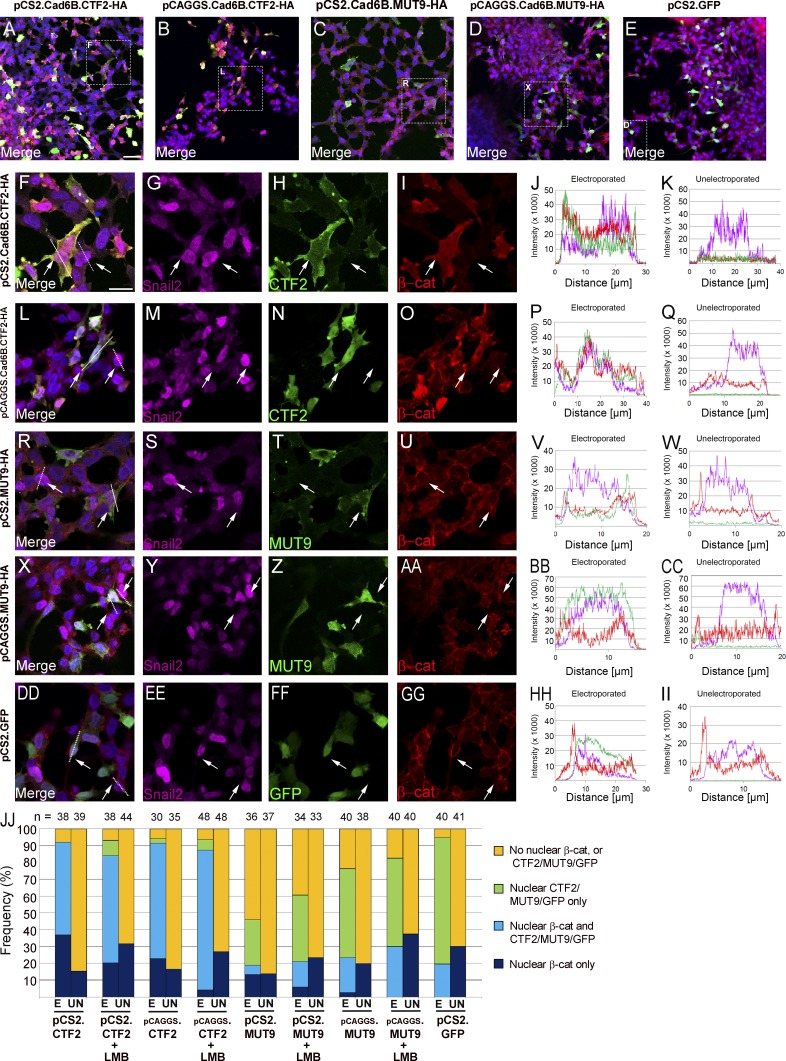
Cad6B CTF2 and β-catenin coimport into the nucleus in cranial neural crest cells ex vivo. Representative explants of neural crest cells overexpressing CTF2-HA (pCS2-CTF2-HA, A and F–I; pCAGGs-CTF2-HA, B and L–O), MUT9-HA (pCS2-MUT9-HA, C and R–U; pCAGGs-MUT9-HA, D and X–AA), or GFP (E and DD–GG), followed by immunostaining for Snail2 (purple), HA or GFP (green), and β-catenin (red). Boxes in lower-magnification 20× merge images (A–E) mark respective magnified (63×) areas (F–I, L–O, R–U, X–AA, and DD–GG). Bar: (A–E) 20 µm; (F–GG) 10 µm. (JJ) Quantification of electroporated (E) and unelectroporated (UN) neural crest cells exhibiting β-catenin nuclear localization reveals a statistically significant increase in the presence of CTF2 but not MUT9. Protein subcellular distribution was determined by fluorescence intensity line profiling (J, K, P, Q, V, W, BB, CC, HH, and II) across candidate cell diameters (arrows and dotted lines in F, L, R, X, and DD). Cell counts were performed based on protein distribution pattern (orange, no nuclear β-catenin or CTF2/MUT9/GFP; green, nuclear CTF2/MUT9/GFP only; light blue, both nuclear β-catenin and CTF2/MUT9/GFP; dark blue, nuclear β-catenin only). Samples sizes (n) for each group shown in JJ.

