Figure 2.
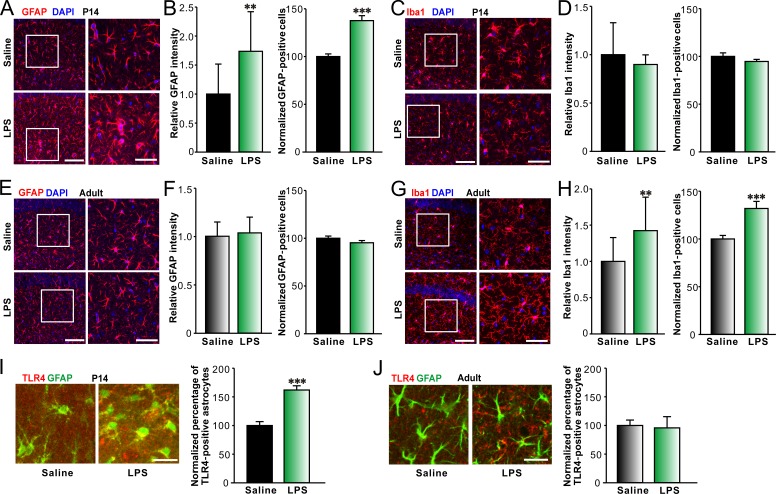
LPS selectively increases astrocyte activation in hippocampal CA1 area in young mice. Representative images of immunohistostaining of GFAP (red) and DAPI (blue; A) or Iba-1 (red) and DAPI (blue; C) and quantification of relative intensity of GFAP (B, left) or Iba-1 (D, left) and normalized GFAP- (B, right) or Iba-1–positive (D, right) cell numbers per unit area in hippocampal CA1 area of P14 mice treated with saline or LPS showing astrocyte activation upon LPS treatment in P14 mice. Bars: (left) 100 µm; (right) 50 µm. n = 13 for each group. Representative images of immunohistostaining of GFAP (red) and DAPI (blue; E) or Iba-1 (red) and DAPI (blue; G) and quantification of relative intensity of GFAP (F, left) or Iba-1 (H, left) and normalized GFAP- (F, right) or Iba-1–positive (H, right) cell numbers in hippocampal CA1 area of adult mice treated with saline or LPS showing microglia activation upon LPS treatment in adult mice. Bars: (left) 100 µm; (right) 50 µm. n = 12 for each group. Representative images (left) of immunohistostaining of colocalization of TLR4 (red) and GFAP (green) in hippocampal CA1 area of P14 (I) and adult (J) GFAP-GFP mice treated with saline or LPS and quantification of the percentage of TLR4-positive astrocytes (right). Bars, 25 µm. n = 10 for each group. **, P < 0.01; ***, P < 0.001 (t test). Data are mean ± SEM.

