Figure 7.
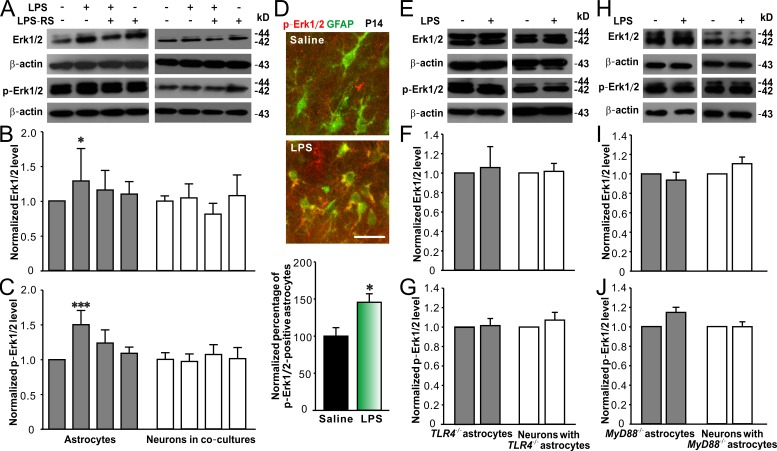
LPS-activated TLR4–MyD88 signaling pathway in astrocytes involves Erk1/2 activation. Representative Western blots of Erk1/2 and p-Erk1/2 from cultured astrocytes and hippocampal neurons (DIV15) in co-cultures (A) and quantification of Erk1/2 (B) and p-Erk1/2 (C) expression showing LPS significantly increased Erk1/2 and p-Erk1/2 levels in astrocytes. n = 4 for each group. (D) Representative images (top) of immunohistostaining of colocalization of p-Erk1/2 (red) in hippocampal CA1 area of P14 GFAP-GFP mice treated with saline or LPS and quantification of the percentage of p-Erk1/2–positive astrocytes (bottom). Bar, 25 µm. n = 11 for each group. Representative Western blots of Erk1/2 and p-Erk1/2 from cultured TLR4−/− astrocytes and neurons co-cultured with TLR4−/− astrocytes (E) and quantification of Erk1/2 (F) and p-Erk1/2 (G). n = 4 for each group. Representative Western blots of Erk1/2 and p-Erk1/2 from cultured MyD88−/− astrocytes and neurons co-cultured with MyD88−/− astrocytes (H) and quantification of Erk1/2 (I) and p-Erk1/2 (J). n = 3 for each group. β-Actin is shown as a loading control. *, P < 0.05; ***, P < 0.001 (in B and C, one-way ANOVA with the post hoc Dunnett’s test; in D, t test). Data are mean ± SEM.

