Figure 8.
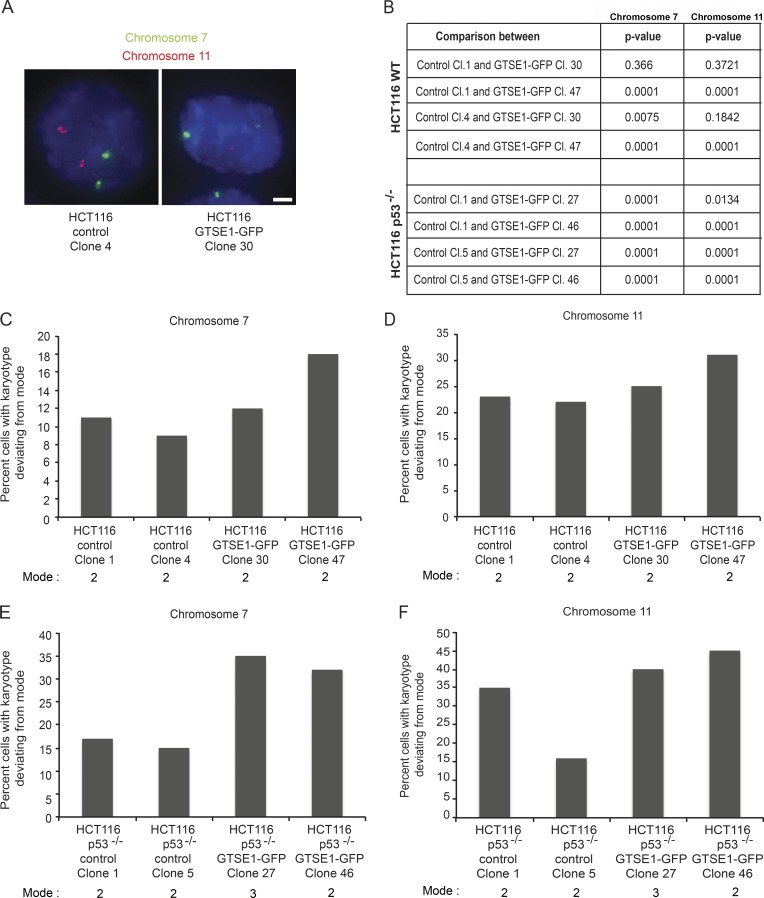
Overexpression of GTSE1 induces CIN in HCT116 cells. (A) Fluorescence images from fixed control or GTSE1-GFP–overexpressing clonal HCT116 cells processed for FISH. Probes for α-satellite regions on chromosomes 7 (green) and 11 (red) are shown and were used to count the number of copies of each chromosome in cells. Bar, 5 µm. (B) Statistically significant values from comparing deviances from the modal number of chromosomes in control versus GTSE1-GFP–overexpressing HCT116 cells from data presented in C–F. P-values were determined from χ2 analysis comparing the indicated clonal cell lines. (C) Percentage of HCT116 control or GFP-GTSE1–expressing clonal cell lines containing numbers of chromosome 7 deviating from the mode. n > 980 cells for each condition. (D) Percentage of HCT116 control or GFP-GTSE1–expressing clonal cell lines containing numbers of chromosome 11 deviating from the mode. n > 980 cells for each condition. (E) Percentage of HCT116 p53−/− control or GFP-GTSE1–expressing clonal cell lines containing numbers of chromosome 7 deviating from the mode. n > 1,000 cells for each condition. (F) Percentage of HCT116 p53−/− control or GFP-GTSE1–expressing clonal cell lines containing numbers of chromosome 11 deviating from the mode. n > 1,000 cells for each condition.

