Figure 4.
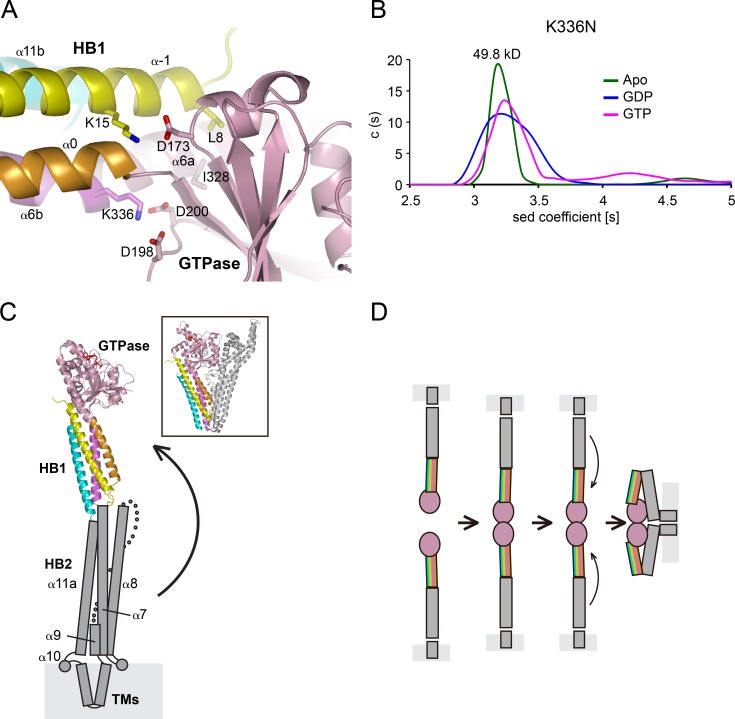
Association between GTPase and HBs of MFN1. (A) The interface between GTPase and HB1. The cartoon representation is colored as in Fig. 1 B. Key residues are indicated as sticks. (B) The size of MFN1–MGD K336N (theoretical molecular mass, 49.5 kD) at 0.4 mM was determined by analytical ultracentrifugation in the presence of the indicated nucleotides. The estimated molecular masses are given above the peaks (in kilodaltons). The data are representative of at least three repetitions. (C) A structural model of full-length MFN1. Predicted HB2 is shown in gray, with secondary structure elements labeled. A possible movement of the HB2 is indicated by an arrow, and the resulting folded configuration may resemble that of BDLP (shown in box for comparison). (D) A simple fusion model for MFN. First, the HBs are extended. Then, upon GTP hydrolysis, HB1 rotates and allows HB2 to bend over and attach to the GTPase, bringing apposing membranes together for fusion.

