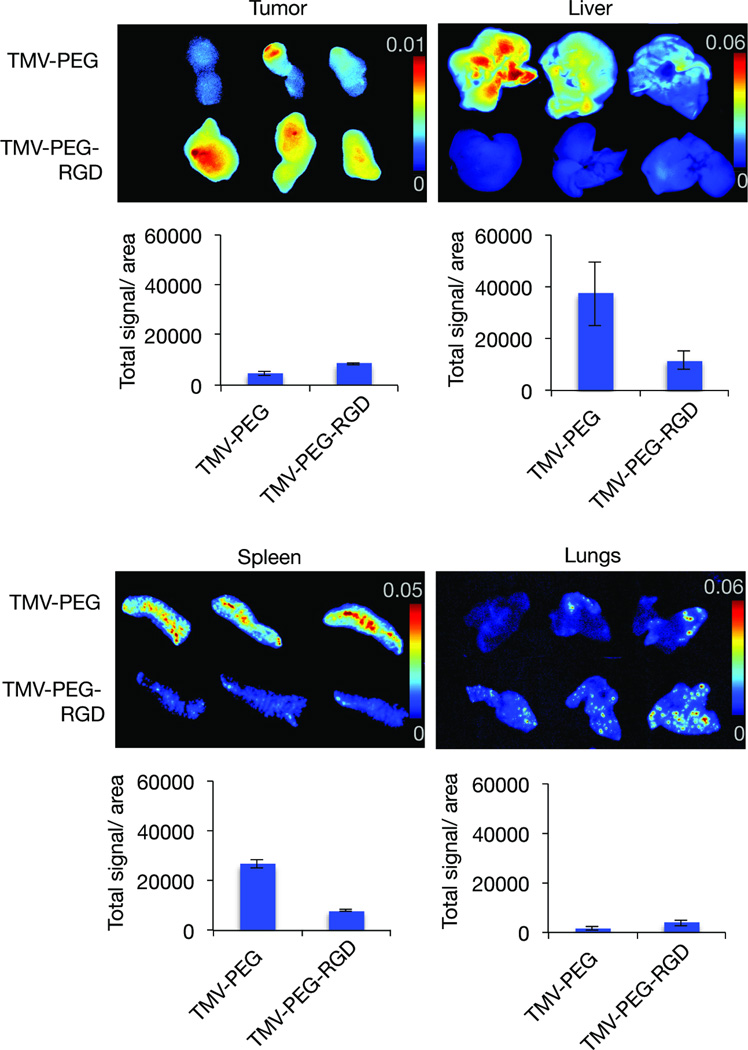
Figure 6. Biodistribution and targeting of TMV-PEG-RGD VNPs.
Representative Maestro fluorescence images showing the biodistribution of VNPs displaying RGD, in a HT-29 cancer mouse model. RGD-targeted TMV accumulates preferentially in HT-29 tumor xenografts in mice with reduced accumulation in liver/spleen (while PEGylated accumulates in liver/spleen > tumor). Maestro imaging of tumors, liver and spleen (n=3; signals shown as heat map.

