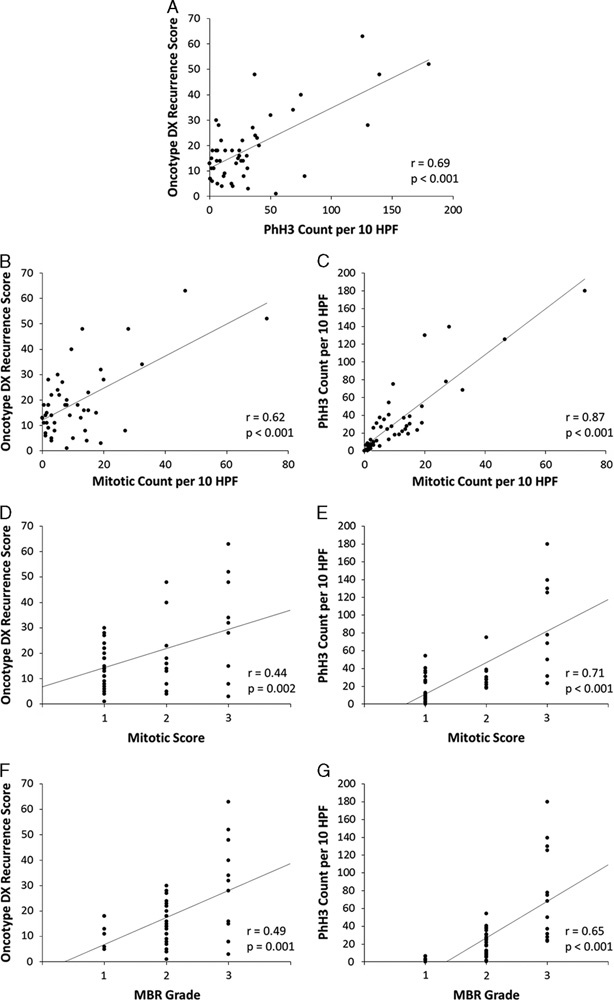
FIGURE 1.

Correlations between (A) Oncotype DX RS and PhH3 count per 10 HPF (B, D, F) Oncotype DX RS and each confounding factor, and (C, E, G) PhH3 count per 10 HPF and each confounding factor. HPF indicates high-power field; MBR, modified Bloom-Richardson-Elston; PhH3, phosphorylated histone H3; RS, recurrence score.
