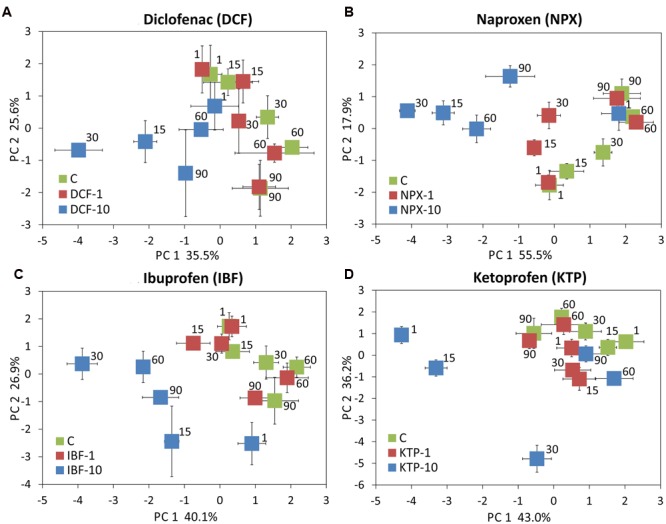
FIGURE 12.

Principal component plots generated from the measured parameters for diclofenac (A), naproxen (B), ibuprofen (C), and ketoprofen (D) on days 1, 15, 30, 60, and 90. C, control soil; DCF-1, soil treated with diclofenac – 1 mg/kg soil; DCF-10, soil treated with diclofenac – 10 mg/kg soil; NPX-1, soil treated with naproxen – 1 mg/kg soil; NPX-10, soil treated with naproxen – 10 mg/kg soil; IBF-1, soil treated with ibuprofen – 1 mg/kg soil; IBF-10, soil treated with ibuprofen – 10 mg/kg soil; KTP-1, soil treated with ketoprofen – 1 mg/kg soil and KTP-10, soil treated with ketoprofen – 10 mg/kg soil.
