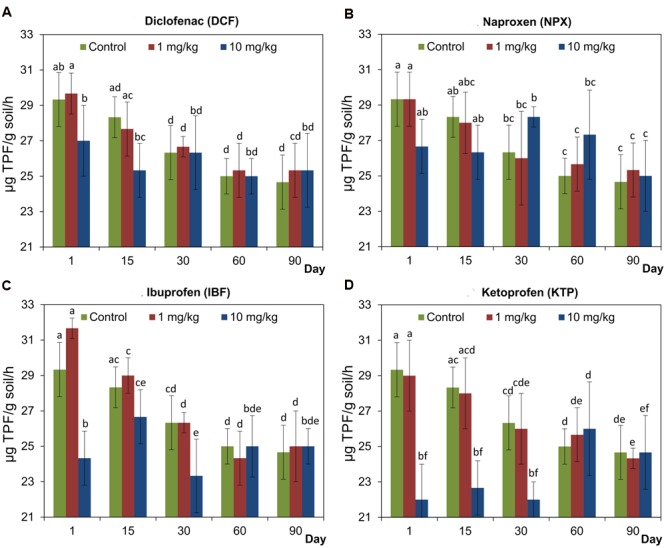
FIGURE 3.

Dehydrogenase (DHA) activity in control soil and soil treated with diclofenac (A), naproxen (B), ibuprofen (C), and ketoprofen (D) at concentrations of 1 and 10 mg/kg soil during the 90-day experiment. The data presented are the means and standard deviations of three replicates and are expressed as μg TPF/g soil/h. Different letters (within each drug) indicate significant differences (P < 0.005, LSD test) related to the effects of concentration and time.
