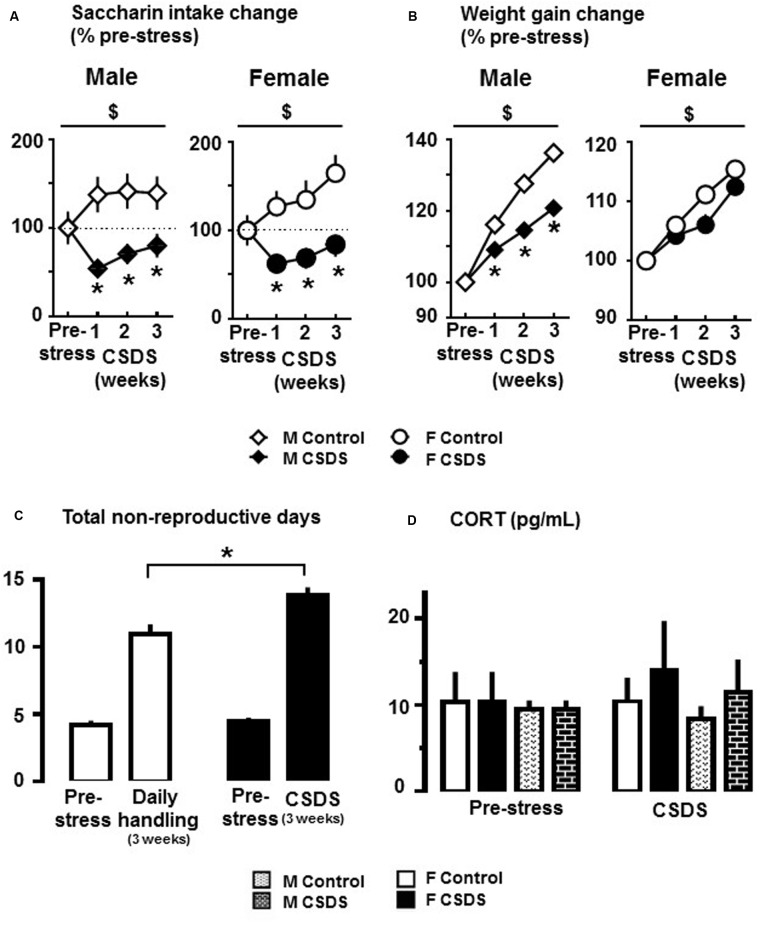
FIGURE 2.
Anhedonia-like responses and endocrine changes in rats exposed to CSDS. (A) Changes of 0.02% saccharin solution consumption in CSDS (male, n = 19; female, n = 16) and control (male, n = 15; female, n = 18) groups. Data are expressed as % change from saccharin intake during the pre-stress period. (B) Average change in body weight gain from pre-stress body weight. Two-way repeated measures of analysis of variance, followed by Holm–Sidak’s post hoc test. $Time effect, ∗Stress effect. p < 0.05. (C) Number of non-reproductive days in CSDS (n = 16) and control (n = 18) females during the pre-stress (sum of 7 days), and CSDS or daily handling (sum of 21 days) periods. Independent t-test, one-tailed ∗p < 0.05 vs. respective control group. (D) Corticosterone (CORT) levels (pg/mL) at the end of the pre-stress and CSDS periods in CSDS (male, n = 4; female, n = 7) and control (male, n = 4; female, n = 4) groups. Mean ± SEM.

