FIGURE 4.
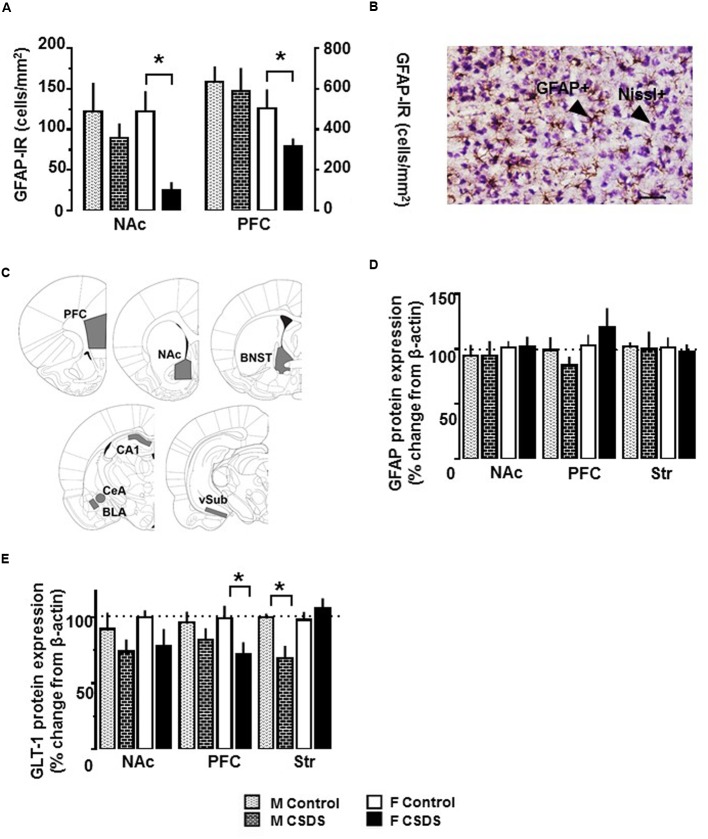
Immunoreactivity of GFAP-expressing astrocytes, and expression of GFAP and GLT-1 protein. (A) Density of GFAP-expressing astrocytes (GFAP+ cells/mm2) in the NAc and PFC in CSDS (male, n = 5; female, n = 6) and control (male, n = 6; female, n = 6) groups, as assessed with immunoreactivity to GFAP (GFAP-IR). (B) Representative photomicrograph of GFAP-IR and Nissl counterstaining in the PFC in CSDS female. Objective, 10X; scale bar, 50 μm. (C) Brain areas used for determining the density of GFAP-expressing astrocytes in CSDS and control groups. PFC, prefrontal cortex (AP +2.7 mm/+2.2 mm); NAc, nucleus accumbens (AP +1.7 mm/+1.2 mm). Protein expression of GFAP (D) and GLT-1 (E) in the NAc, PFC, and dorsal striatum (Str) in CSDS (male, n = 11; female, n = 6–8) and control (male, n = 7–9; female, n = 6–7) groups. Data are expressed as % change from β-actin. Independent t-test, ∗p < 0.05 vs. same sex control. Mean ± SEM.

