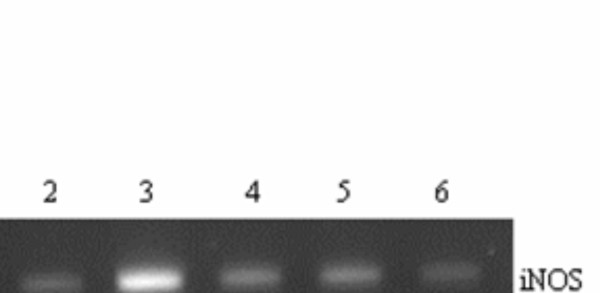
Figure 7.
Effect of RC, FC and TC on the iNOS gene expression in rat hippocampal slices subjected to OGD and OGD+RC/FC/TC. Lane 1 – Control, Lane 2 – OGD 24 hr, Lane 3 – OGD 48 hr, Lane 4 – OGD + FC, Lane 5 – OGD+TC, Lane 6 – OGD+RC. *p < 0.05 vs control, **p < 0.001 vs control, +p < 0.001 vs **. Results expressed are a mean of 6 independent experiments ± SEM.

