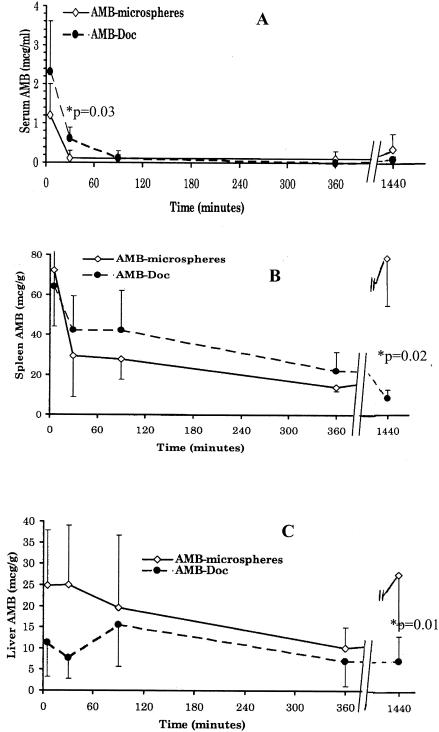
FIG. 3.
AMB concentration (average values and standard errors [bars]) versus time in serum (A), spleen (B), and liver (C) after the injection of AMB microspheres or AMB-Doc with a dose of 2 mg of AMB/kg by the intracardiac route. The P values are indicated for the points with significant differences.

