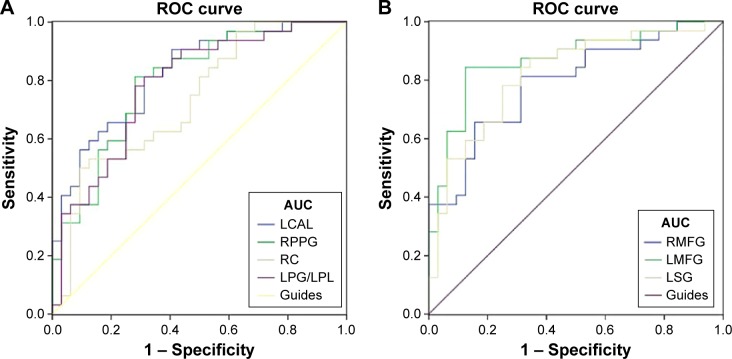
Figure 3.
ROC curve analysis of the mean ALFF values for altered brain regions.
Notes: The areas under the ROC curve were 0.824 (P<0.001; 95% CI: 0.725–0.924) for the LCAL and cutoff point values −0.4835, sensitivity: 0.813, specificity: 0.687; 0.796 (P<0.001; 95% CI: 0.687–0.905) for the RPPG and cutoff point values −0.166, sensitivity: 0.813, specificity: 0.719; 0.731 (P=0.001; 95% CI: 0.608–0.855) for the RC and cutoff point values −0.1590, sensitivity: 0.5, specificity: 0.906; 0.784 (P<0.001; 95% CI: 0.671–0.897) for the LPG/LPL and cutoff point values 0.467, sensitivity: 0.75, specificity: 0.719 (MBs > HCs) (A). The areas under the ROC curve were 0.791 (P<0.001; 95% CI: 0.681–0.901) for the RMFG and cutoff point values 0.467, sensitivity: 0.813, specificity: 0.656; 0.868 (P<0.001; 95% CI: 0.777–0.959) for the LMFG and cutoff point values 0.236, sensitivity: 0.844, specificity: 0.875; 0.819 (P<0.001; 95% CI: 0.715–0.924) for the LSG and cutoff point values 0.061, sensitivity: 0.875, specificity: 0.656 (MBs < HCs) (B).
Abbreviations: ROC, receiver operating characteristic; ALFF, amplitude of low-frequency fluctuation; CI, confidence interval; HCs, healthy controls; LCAL, left cerebellum anterior lobe; RPPG, right parahippocampal gyrus; RC, right cuneus; LPG, left precentral gyrus; LPL, left paracentral lobule; RMFG, right middle frontal gyrus; LMFG, left middle frontal gyrus; LSG, left supramarginal gyrus; AUC, area under the curve.

