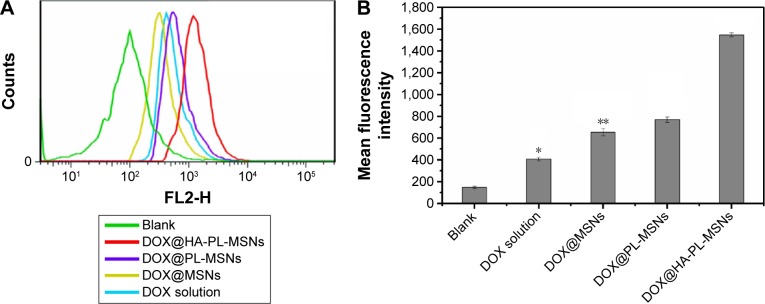
Figure 10.
(A) Flow cytometry histogram profiles of DOX florescence within HeLa cells and (B) quantitative analysis of mean fluorescence intensity when incubated with a series of particles for 6 h.
Notes: Data are represented as mean ± SD (n=3). *Statistical difference versus the DOX@HA-PL-MSNs group (P<0.05); **statistically significant difference versus the DOX@HA-PL-MSNs group (P<0.01).
Abbreviations: DOX, doxorubicin; HA, hyaluronic acid-functionalized; MSN, mesoporous silica nanoparticle; PL, pH stimuli-responsive lipid membrane; SD, standard deviation.

