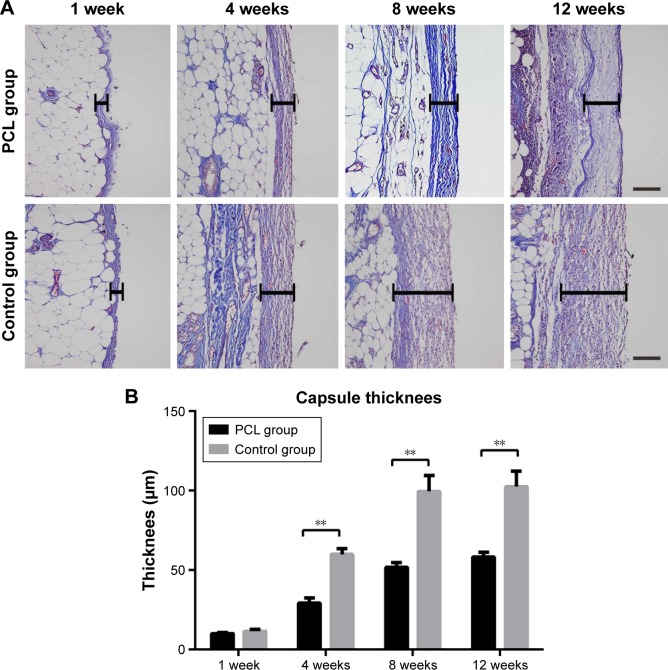
Figure 8.
Changes in capsule thickness at different times.
Notes: The thickness of the capsule reached the peak at week 8, and then remained almost unchanged from weeks 8 to 12 (A). Statistical analysis demonstrated that the adipose flap capsule of the control group was much thicker than that of the PCL group from weeks 4 and 12. All data were expressed as mean ± standard deviation. **P<0.001 compared between PCL group and control group. Results are in response to an analysis of Student’s t-test of both groups (B). Scale bar =100 μm.
Abbreviation: PCL, polycaprolactone.

