Figure 6.

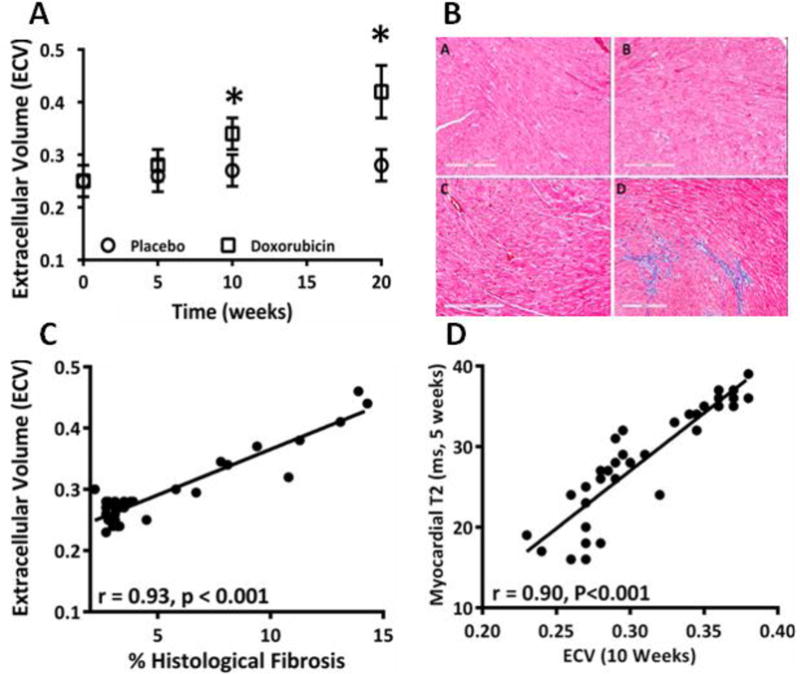
A) Serial ECV values in DOX-treated and placebo-treated animals over time showing an increase in the ECV at 10 weeks and 20 weeks as compared with the placebo (P < 0.001 for ANOVA, * = P < 0.05 for between group comparisons); B) Cardiac sections stained with trichrome for detection of fibrosis with representative sections from placebo (a) and DOX-treated (b) mouse at 5 weeks and again at 10 weeks [placebo (c), DOX (d)] showing that myocardial fibrosis did not change at 5 weeks but increased by 10 weeks.
C) There was a strong association between the CMR-measured ECV and the extent of myocardial fibrosis by histology; D) Strong correlation between the early increase in edema at 5 weeks and the subsequent increase in fibrosis by ECV at 10 weeks.
