Figure 7.

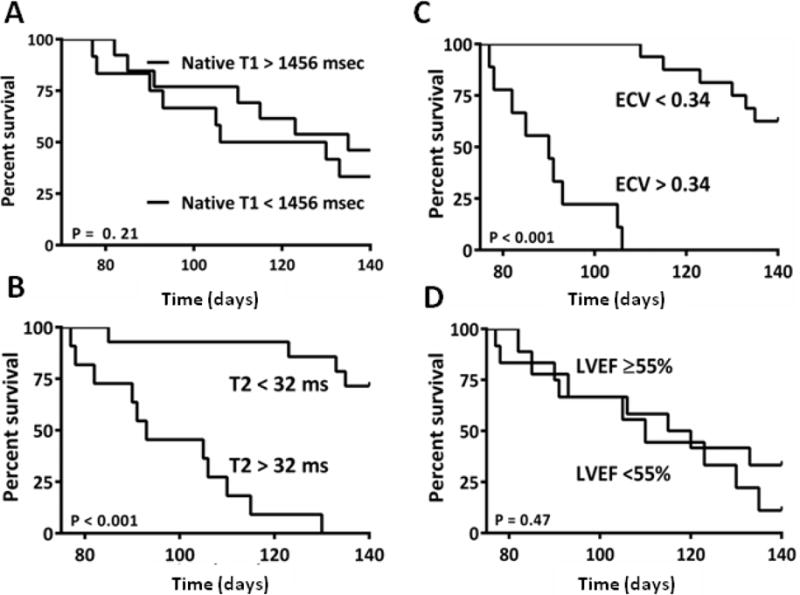
Figure 5: A) The T1 values were increased at 5 weeks after chemotherapy. Survival curves based on the median measures of cardiac T1 at 5 weeks showing that the early increase in T1 did not predict the DOX-induced mortality; B) The T2 values were increased at 5 weeks after chemotherapy. Survival curves based on the median measures of cardiac edema at 5 weeks showing that the early increase in edema predicted the DOX-induced mortality; C) The ECV was increased at 10 weeks after chemotherapy. Survival curves based on the median measures of the ECV at 10 weeks showing that the intermediate increase in fibrosis predicted the DOX-induced mortality; D) The LVEF was reduced at 10 weeks after chemotherapy. Survival curves based on the median LVEF at 10 weeks showing no difference in animal mortality between mice with an LVEF above and below the median value.
