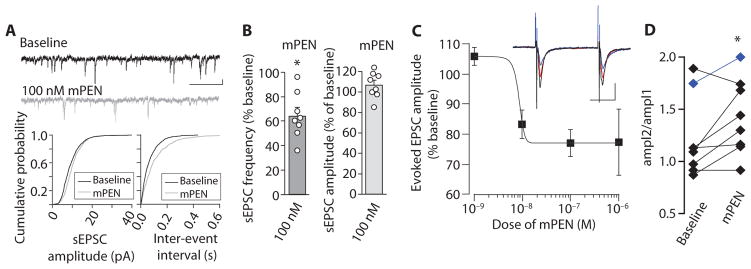
Fig. 2. Effect of mPEN on synaptic activity of PVN neurons in rat hypothalamic slices.
(A) Spontaneous excitatory postsynaptic current sEPSC traces (top) in a PVN neuron after bath application of 100 nM mPEN (scale bar, 5 pA and 200 ms). Cumulative plots for this neuron demonstrate the effect of mPEN on sEPSC amplitudes (left) and inter-sEPSC intervals (right). (B) Graphical representation of frequency (left) and mean amplitudes (right) of sEPSCs in PVN neurons after mPEN application. Each circle represents an individual neuron. (C) Dose response for change in evoked EPSC amplitude. Frequency (baseline, 5.8 ± 1.7 Hz; mPEN, 3.9 ± 1.3 Hz; P = 0.03; n = 8); amplitude (baseline, 11.8 ± 1.5 pA; mPEN, 12.5 ± 1.6 pA; P = 0.24; n = 8 individual neurons); and inset, example traces of evoked responses from one cell. Black, baseline; red, 10 nM mPEN; blue, 100 nM mPEN. Scale bars, 40 pA and 20 ms. n = 3 to 5 cells per dose. (D) The paired-pulse ratio in PVN neurons in response to 100 nM PEN. The data in blue are from the one neuron where the highest dose tested was 10 nM PEN. The data represent means ± SE (n = 3 to 8 individual experiments). *P < 0.05 [paired two-tailed t test for (B) and (D); for statistical analysis, see table S1].

