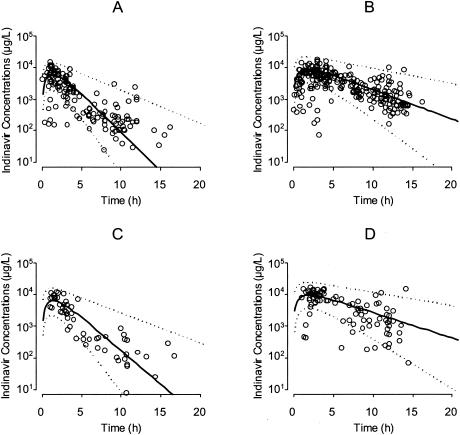
FIG. 1.
Plasma indinavir concentrations in samples from 239 HIV patients (circles). Samples from male patients receiving 800 mg of indinavir t.i.d. (A) or 800 mg of indinavir b.i.d with low-dose ritonavir (B) and from female patients receiving 800 mg of indinavir t.i.d. (C) or 800 mg of indinavir b.i.d. with low-dose ritonavir (D) are shown. Circles represent patient samples; solid line, average population prediction value; dashed lines, 95% prediction intervals.

