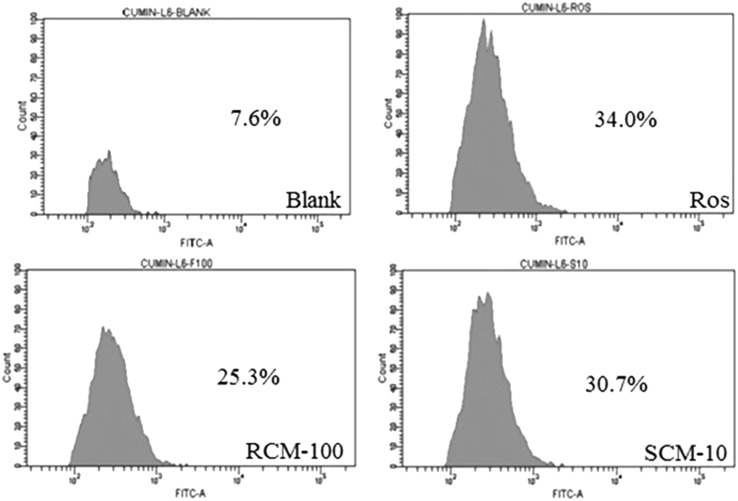
Fig. 1.
Flow cytometry analysis of 2-NBDG uptake. FACS analysis of 2-NBDG uptake in differentiated L6 cells by plotting cell count against FITC. The groups contained untreated cells (Blank), Rosiglitazone (Positive control, 100 nM), cells treated with methanol extract of Raw (RCM-100 µg/mL) and Spent (SCM-10 µg/mL) cumin

