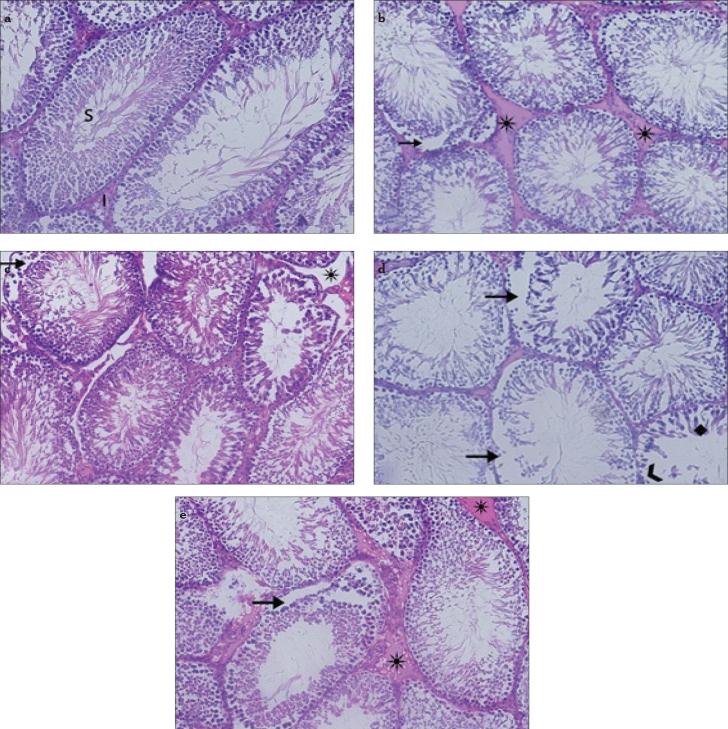
Figure 2.
a–e. Appearance of testes by light microscope. Control group (a), S: seminar tubul, I: interstitial space, ×200. Diabetic control group (b), (*) edema, (black arrow) separation in the basal cells of the seminiferous tubules. Diabetic lycopene group (c), (black arrow) separation in the basal cells of the seminiferous tubules, (*) edema. Diabetic furan group (d), (black arrow) separation in the basal cells of the seminiferous tubules, (♦) degeneration, (>) basal cell loss in the seminiferous tubules. Diabetic furan + lycopene group (e), (*) edema, (black arrow) separation in the basal cells of the seminiferous tubules

