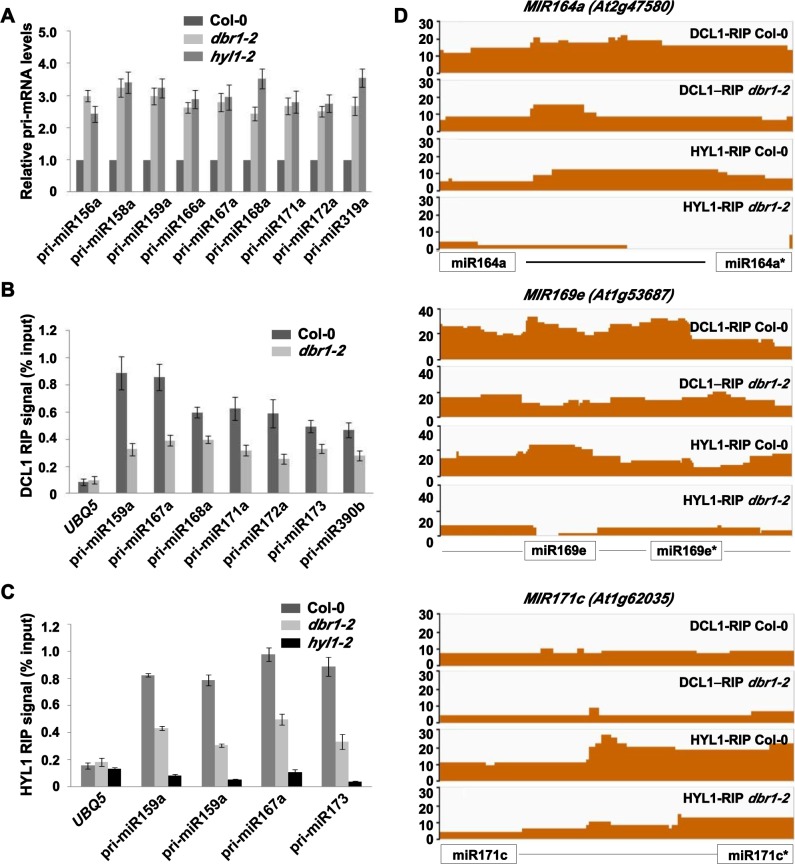
Fig 2. Pri-miRNA binding to DCL1 and HYL1 is reduced in dbr1-2.
(A) Detection of pri-miRNAs in Col-0, dbr1-2 and hyl1-2 by qRT-PCR. UBQ5 was the loading control. Standard deviations were calculated from three biological replicates. (B and C) Association between pri-miRNAs and the DCL1/HYL1 complex by RIP analysis. RNA was immunoprecipitated from inflorescences or seedlings of Col-0 and dbr1-2 using DCL1 or HYL1 antibodies, respectively. The amount of pri-miRNAs was determined by qRT-PCR and normalized to the input. hyl1-2 was used as the negative control for HYL1 antibody. UBQ5 was used as a negative control. Error bars show SE calculated from three biological replicates. (D) The occupancy of DCL1 and HYL1 at MIR164a, MIR169e, and MIR171c. The coverage regions are shown as normalized peaks. The x axis indicates the relative position of miRNA and miRNA* location. The y axis indicates normalized peaks from the genomic region. Reads counts were normalized to tag per 10 million (TP10M) to adjust for sequencing depth differences of the two RIP-seq libraries.

