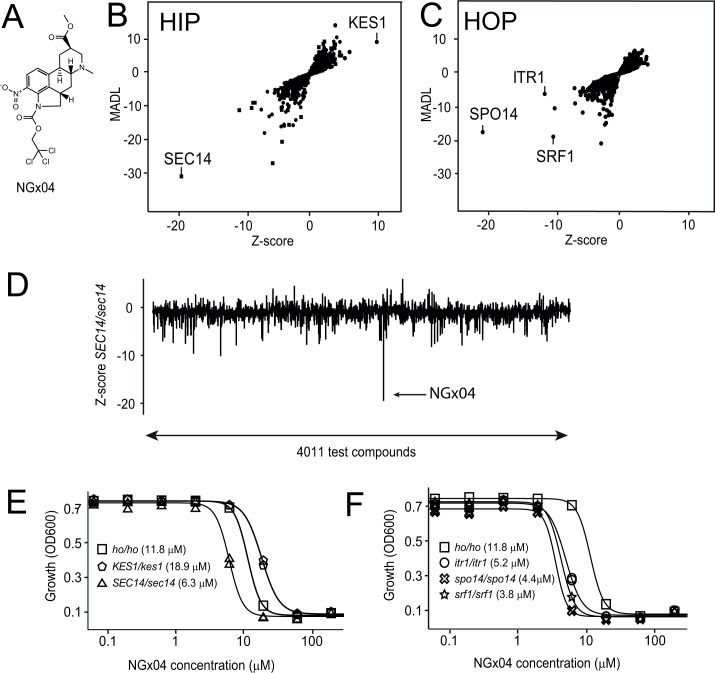
Fig 1. Chemogenomic profiling.
Structure, haploinsufficiency profiling (HIP) and homozygous profiling (HOP) of NGx04. A) The structure of NGx04 is shown. B) HIP and C) HOP were performed around IC30 (8 μM) in duplicates and the average of the profiles is shown. The MADL score is given on the y-axis and indicates how sensitive a particular deletion strain is to a given compound, compared to its no-drug control. The Z-score is given on the x-axis and is a statistical measure of how frequently a particular deletion strain is affected within the so far profiled compounds [26]. Circles depict non-essential deletions, whereas squares essential deletions. Hyper-sensitive deletions are found bottom left and hyper-resistant deletions top right of the panels. D) Hypersensitivity of a heterozygous SEC14/sec14 strain across 4011 diverse compounds (x-axis) is displayed as Z-score (y-axis). NGx04 (arrow) was found to exert the strongest effect. Validation of the hit candidates from HIP E), HOP F) was performed by single strain growth inhibition. The indicated strains were grown for 24 h in the presence of increasing concentrations of NGx04 and growth measured by turbidity (OD600). Duplicate values were determined and used for logistic regression. The calculated IC50 values are displayed.

