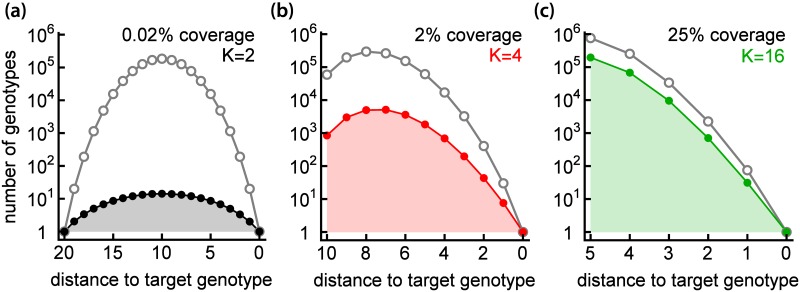
Fig 5. Accessible pathways cover a large part of FL for K > 2.
The total number of genotypes (grey) and the genotypes belonging to accessible pathways (colours black, red, and green) as a function of Hamming distance from the target genotype, for fitness landscapes with different number of coding units K = 2, 4, 16 (panels a, b, c) and the same number of genotypes N = 220. The shaded area under the curve corresponds to the total number of genotypes (for any distance) that belong to accessible pathways. Coverage (the fraction of genotypes in accessible pathways) is also shown.

