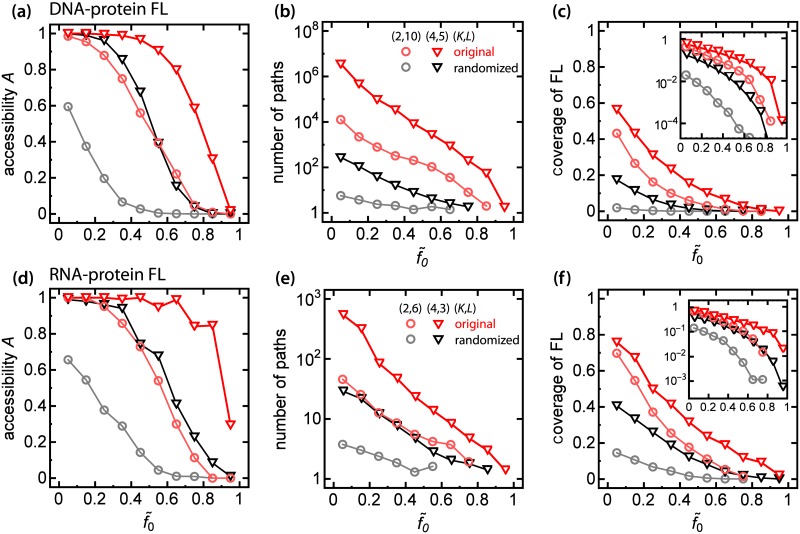
Fig 7. Fitness-to-distance correlation impacts accessibility and coverage of the experimental FLs.
Panels (a-c): data from Rowe et al. [39], panels (d-f): data from Guenther et al. [42]. (a,d) Accessibility of the sub-FLs for K = 2, 4 (red circles, red triangles), and for their randomized counterparts (grey, black) as a function of rescaled initial fitness . In the presence of fitness-to-distance correlations landscapes with high levels of are mostly accessible compared to the case with no correlations. (b,e) Number of paths exhibits as a function of rescaled initial fitness . Presence of fitness-to-distance correlations increased number of pathways by a few orders of magnitude compared with the randomized ensemble. (c,f) Coverage of experimental sub-FLs and their randomized counterparts as a function of . The insets show the same data in semi-log scales. In the case of K = 2 correlations increase the fraction of accessible genotypes to levels observed for FLs with K = 4.

