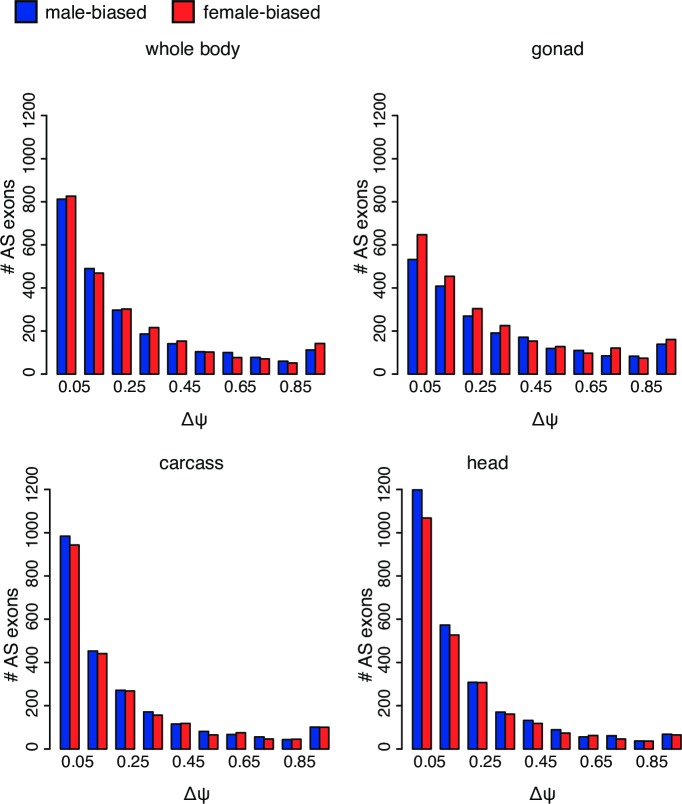
Fig 5. Sex-biased splicing in D. pseudoobscura.
Comparisons of ΔΨ distributions are between males and females for whole body (top left), gonad (ovary and testis, top right), carcass (bottom left), and head (bottom right). The x-axis gives ΔΨ values and the y-axis shows the number of sex-biased exons. Red bars represent female-biased exons (Ψfemale− Ψmale > 0) and blue bars represent male-based exons (Ψmale− Ψfemale > 0).

