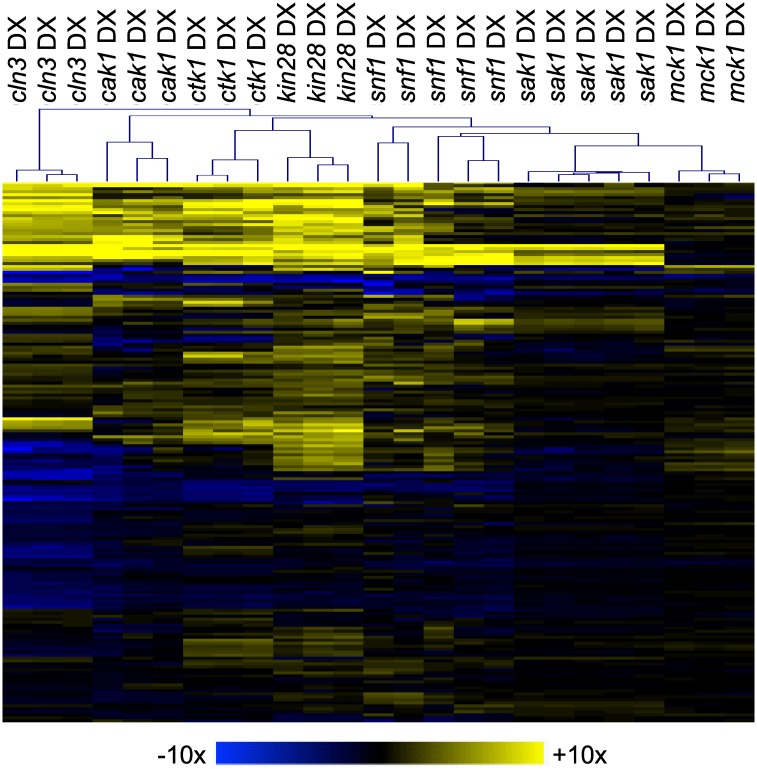
Fig 2. DX mutant isolate comparison.
Multiple isolates of each DX strain indicated were obtained from a single transformation of a heterozygous deletion mutant. RNA was extracted from cells grown for 4 hr at 30°C in YPD and used for nanoString expression analysis (S3 Table). Hierarchal clustering of gene expression data was performed using MeV software. Fold change values were obtained by dividing normalized expression values for each mutant strain by the wild-type strain (DAY185) for each of the probes. The color scale represents Log2 fold change compared to wild type. (Blue limit: 10-fold down; yellow limit: 10-fold up.) Strains are listed in S3 Table.

