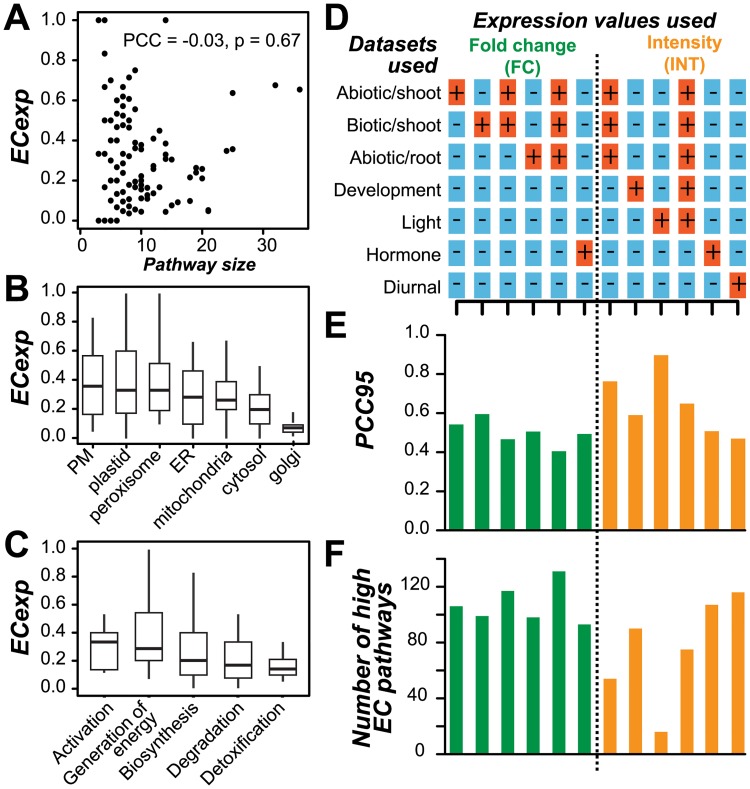
Fig 3. Impact of pathway size and other factors on EC.
(A) Relationship between ECexp of a pathway and pathway size (the number of genes assigned to a pathway). (B) ECexp value distribution for pathway genes with products that have subcellular location annotations. PM: Plasma membrane. ER: Endoplasmic reticulum. (C) ECexp value distribution for different pathway classes (general pathway categories). (D) Datasets used to determine pathway ECs. A “+” indicates that the dataset in question was used (either individually or in combination) for the analyses depicted by bar graphs in (E) and (F). The columns in (D) correspond to those in (E) and (F). (E) The 95th percentile PCC values (PCC95) in the null distributions for each dataset or combination of datasets. PCC95 of combined datasets (stress fold change and light (L)+stress (S)+development (D) absolute intensity) are labeled in the bar plot (F) Number of pathways with high EC for each dataset and/or combination of datasets. Green: fold change values were used to calculate ECs. Orange: absolute intensity values were used for calculating ECs.

