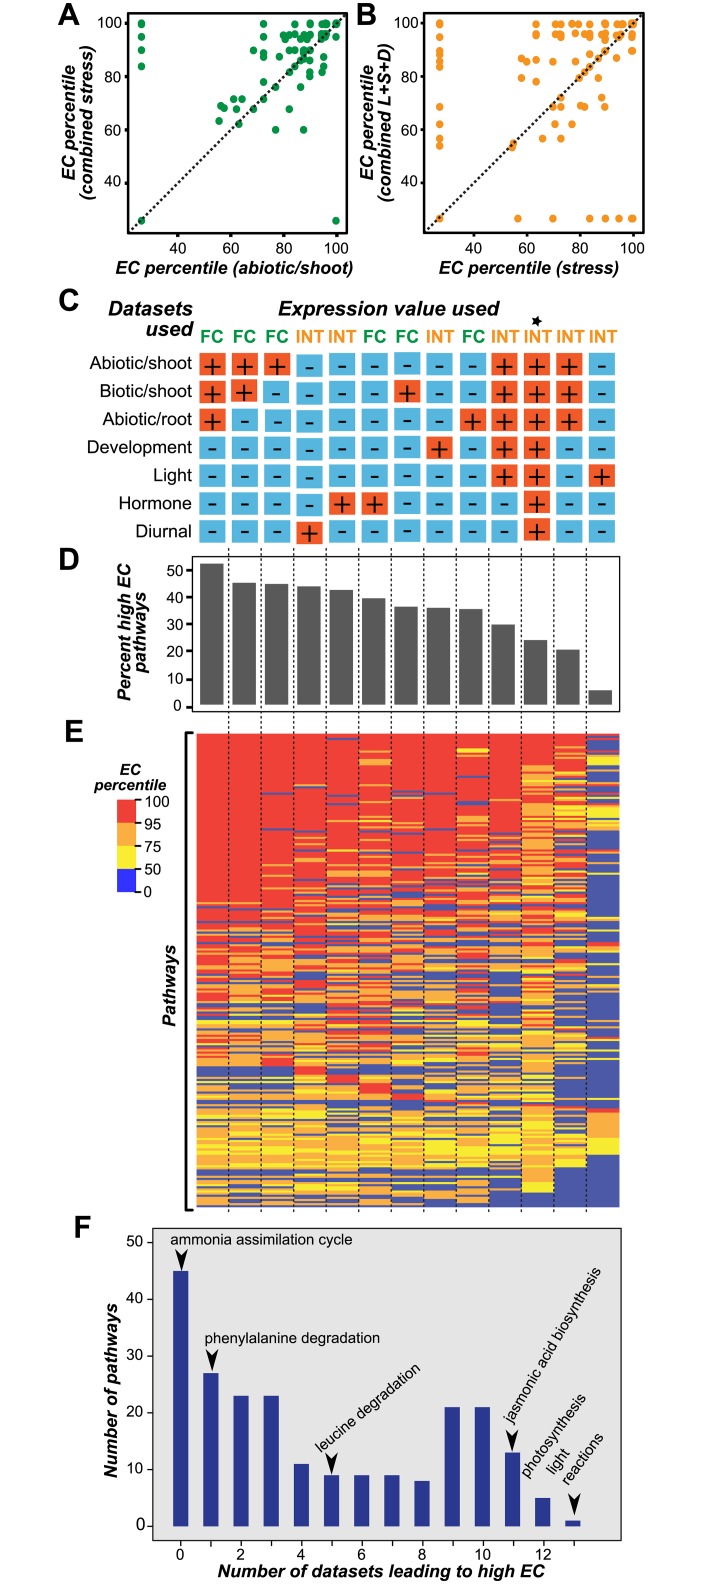
Fig 4. Impact of datasets on pathway EC percentile.
(A) Relationship between pathway EC percentiles calculated using the combined stress gene expression dataset and those calculated based on one of the individual stress datasets, abiotic/shoot. (B) Relationship between pathway EC percentiles calculated using the light, development and stress combined dataset and those calculated based on individual dataset, stress. In (A) and (B) the dashed line represents y = x, and each dot represents a pathway. (C) Individual and combinations of datasets used to determine pathway EC Percentiles. *: NASCArray consisting of all the datasets listed here as well as additional datasets (~700 samples). The columns in (C) correspond to those in (D) and (E). (D) Bar plot of percent high EC pathways using different expression datasets (E) Heat map of pathway EC percentiles from 13 gene expression datasets. Dark red: EC percentiles≥ 95. Orange: 95 > EC percentiles < 75. Yellow: 75 > EC percentiles <50, Blue: 50 > EC percentiles < 0 (F) Histogram of the numbers of datasets leading to high EC values for each pathway. Example pathways are labeled with an arrow.

