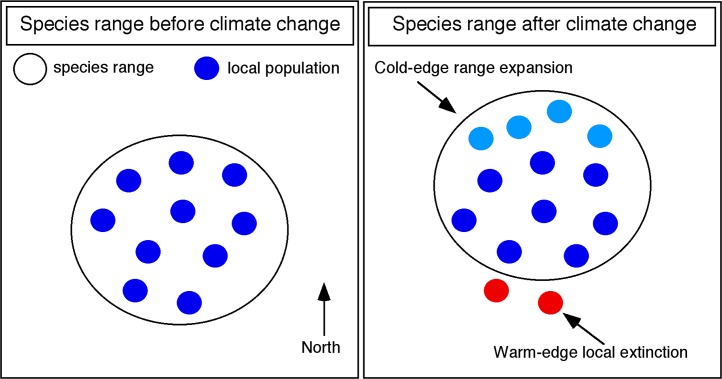
Fig 1. Hypothetical example illustrating the two components of a geographic range shift associated with climate change.
The large open circle indicates the species’ overall geographic range. Small dark blue circles indicate populations before climate change. After climate change, the overall geographic range is shifted northward (large open circle), both through the range expansion (new populations; small light blue circles) added at the northern, “cold” edge of the species range and range contraction (local extinction of original populations; small red circles) at the southern, “warm” edge of the species range. Similar patterns occur for range shifts along an elevational gradient. Modified from Cahill et al. [12].

