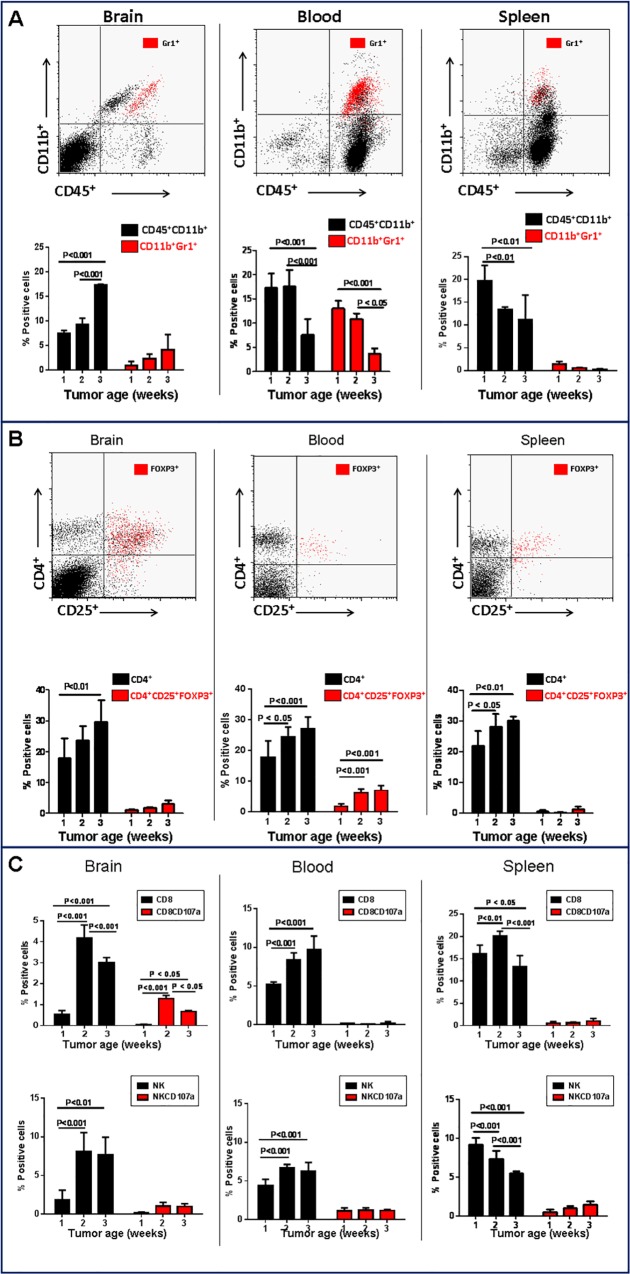
Fig 1. Changes in frequency of immune cell populations during glioma progression.
The frequency of different immune subsets was evaluated in brain, blood and spleen during progression of intracranial GL261 gliomas over a three-week period. A) Flow cytometry analysis of CD11b+CD45+ myeloid cells and CD11b+Gr1+ (marker of myeloid derived suppressor cells). B) Flow cytometry analysis of CD4+CD25+Foxp3+ and C) CD8+ T and NK cell. Data is representative of two separate experiments. n = 3 mice/group ± SD.

