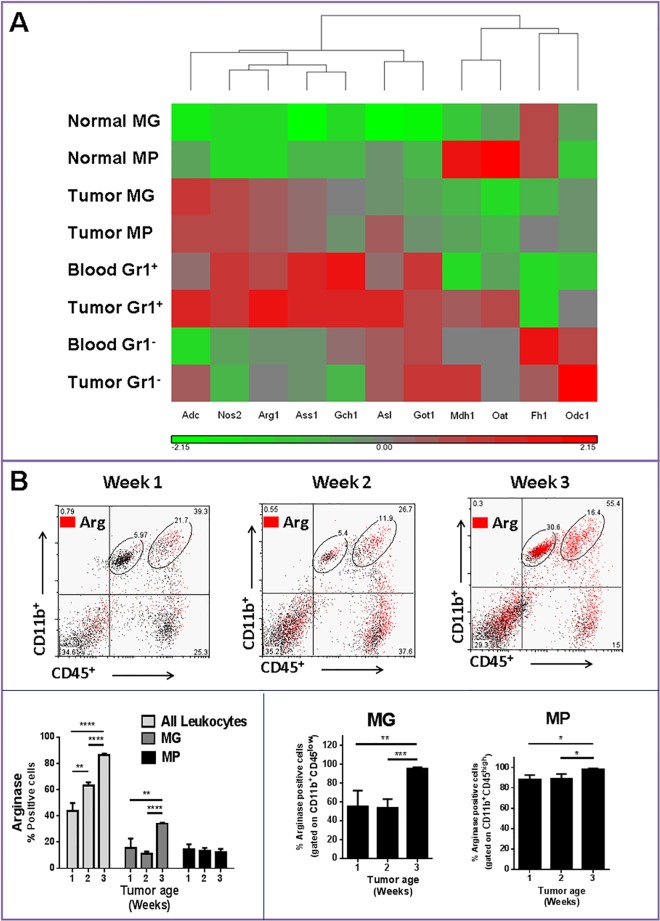
Fig 2. Upregulation of the arginase pathway in tumor infiltrating microglia (MG) and macrophages (MP).
A) Heat map showing clustering of genes involved in the arginase pathway. All genes shown are upregulated or down regulated more than two fold in tumor-bearing compared to control animals. Grey indicates no change in gene expression, whereas red and green indicate an increase or decrease in expression, respectively, relative to control normal mice. B) Flow cytometry analysis of arginase 1 (Arg) expression in MG/MP population during glioma progression. Data is representative of two separate experiments. n = 3–4 mice/group ± SD.

