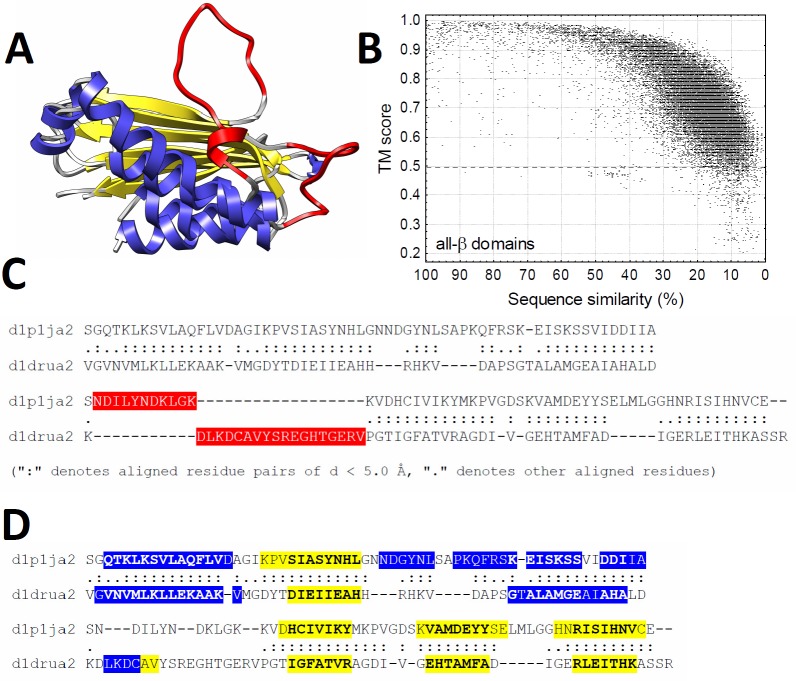
Fig 1. The outline of the comparative analyses.
A) For all domains of every SCOP class, pairwise structural alignments were created with TMalign (blue–helices, yellow–strands, red–unaligned regions). B) Structural alignments with TM score below 0.5 were excluded from the analysis, and the pairwise alignments were ordered according to the sequence similarity of the aligned structures. C) Structurally unaligned regions (red) were refined with Rascal, resulting in high quality pairwise alignments. D) In the pairwise alignments the secondary structure, RSA and contact density were determined for each residue.

