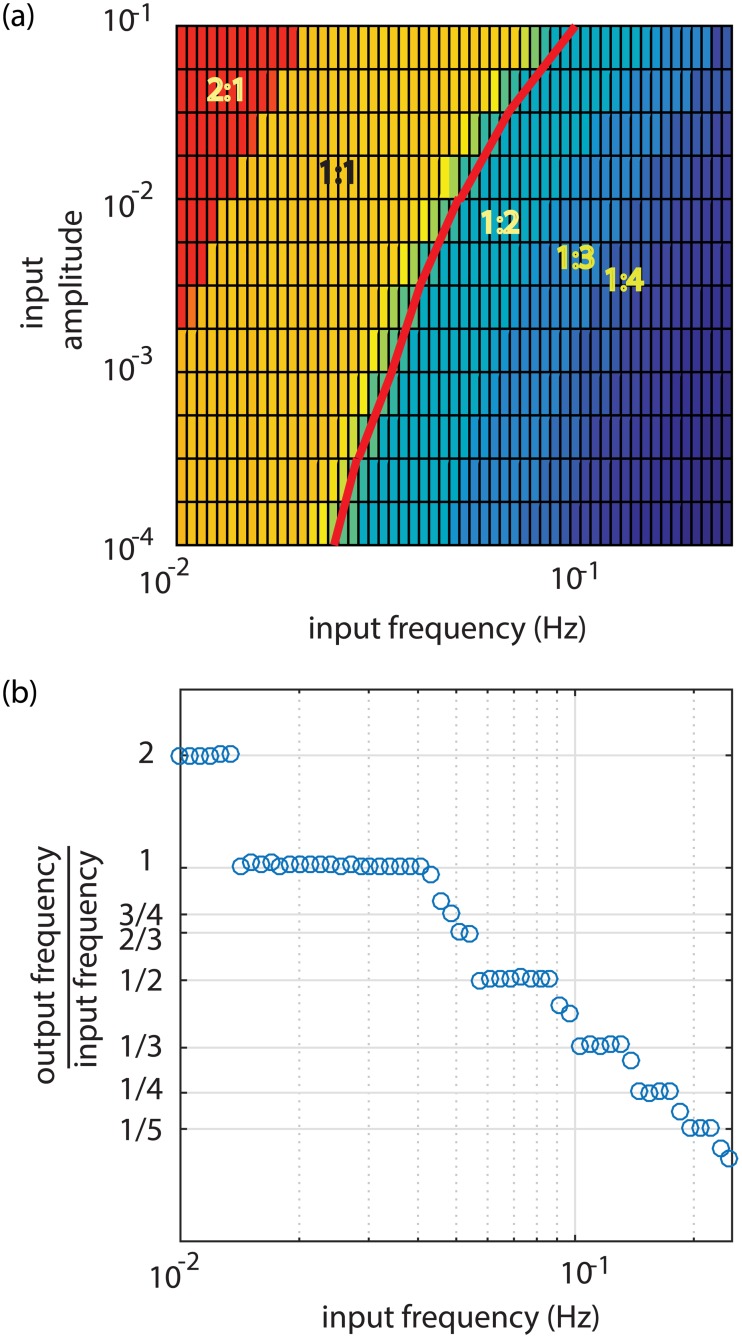
Fig 8. Synchronization of the shear-NO oscillator with a sinusoidal input.
a) Color bands indicate domains in which the output and input frequencies lock into simple, integer ratios. The red curve gives an estimate of the autonomous frequency from f = 1/(tclog(CNOmax/σ) where the amplitude of the noise has been replaced by the amplitude of the input sinusoid, b) Output frequencies at input amplitude of 0.01 showing a so-called Devil's staircase of discrete, rational values.

