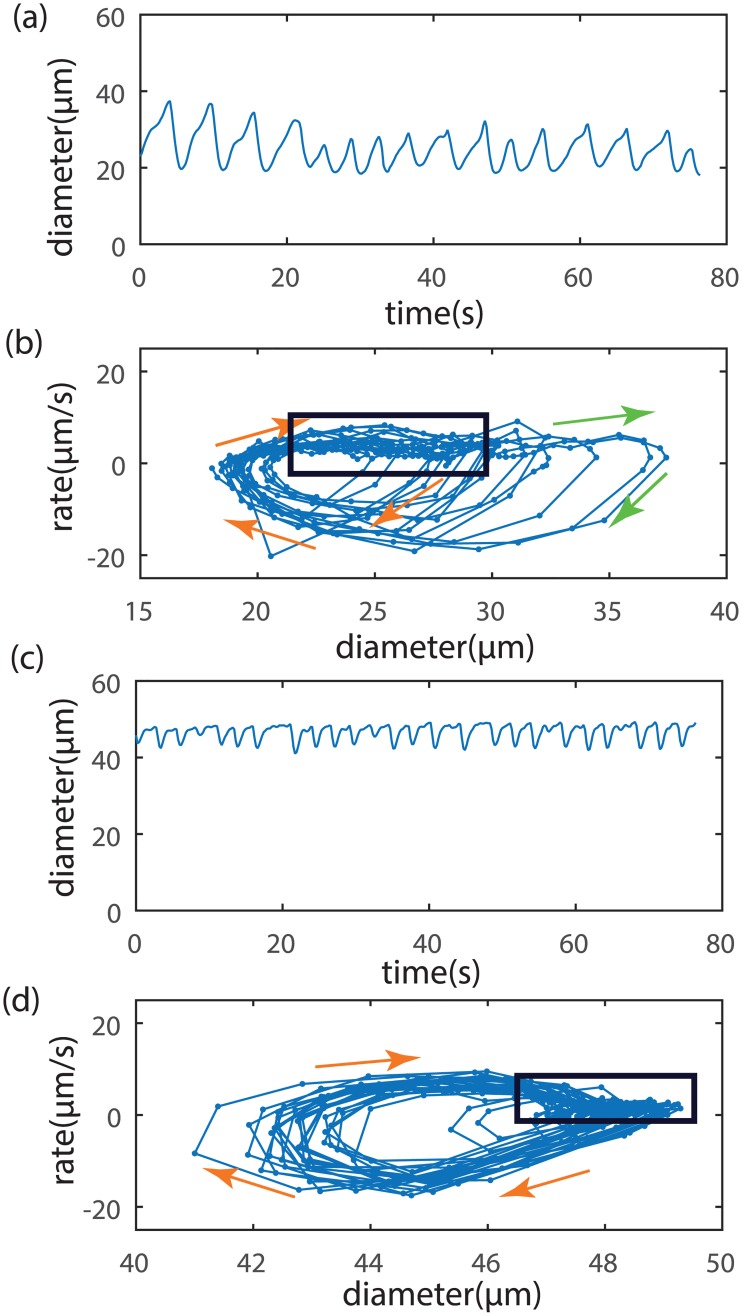
Fig 10. Typical in vivo experimental measurements of lymphangion diameter (a,c) in a mouse with phase portraits of diameter vs. rate of diameter change (b,d) [20].
a,b) Wild type mice with Ca2+ and NO active. c,d) NO effects genetically deleted in eNOS-/- mice. Spacing of data points indicates the rate of motion in the phase plane (sampling period 0.21 s). The box surrounds a region of closely spaced points indicative of an equilibrium condition. Orange arrows show the trajectory during a contraction, while green arrows show a dilation. Contraction and dilation dynamics are generally more erratic when the vessel is small and has active NO than when the vessel is larger and has suppressed NO activity.

