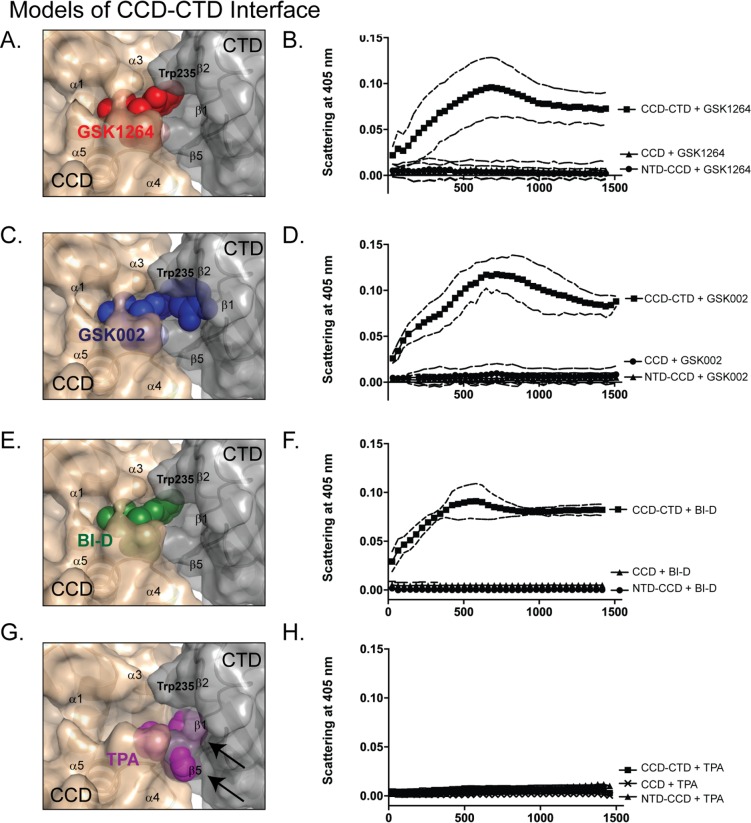
Fig 4. Experimental probing of the GSK1264 interface.
Models of the catalytic domain–CTD interface with bound small molecules (A, C, E, and G) are shown beside aggregation time course assays for the same compounds (B, D, F, and H). Aggregation assays contained one and two-domain fragments of INF185H as indicated (“CCD” denotes catalytic core domain). Compounds studied are GSK1264 (A, B; red, PDB 4OJR [7]), GSK002 (C,D; blue, PDB 5HRN [this work]), BI-D (E, F; green, PDB 4ID1 [8]), and tetraphenylarsonium (TPA; G, H; magenta, PDB 1HYV [10]). Models were generated by docking the indicated CCD/compound structures into the GSK1264/ INF185H structure studied here. Aggregation assays were carried out using light scattering at 405 nm at 25°C with 10 μM IN (see S1 Data). In panel G, arrows indicate steric clashes predicted by modeling of the CTD–catalytic core domain interface with TPA, based on the TPA binding mode in PDB 1HYV [10].

