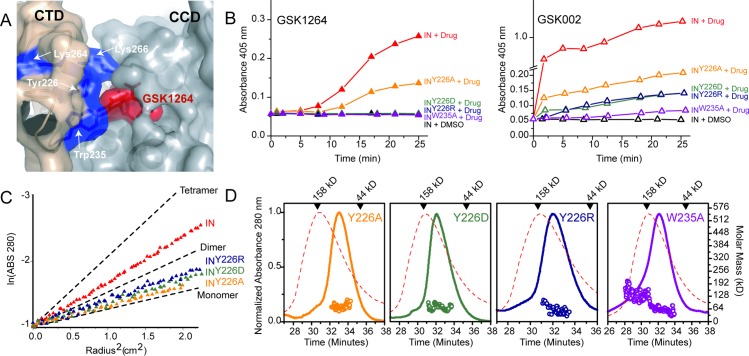
Fig 5. CTD substitutions affect IN oligomerization and ALLINI-induced aggregation.
(A) CTD residues (shown in blue) at the INF185H–ALLINI interface mapped onto the INF185H–GSK1264 structure. GSK1264 is shown in red. Mutations at K264 and K266 that affect ALLINI function were previously reported [24]; the effects of mutations at Y226 and W235 are reported here. (B) Aggregation assays. The time-dependent aggregation of IN by GSK1264 and GSK002 was monitored using absorbance optics. To initiate the reaction, either DMSO or drug was added to recombinant INF185H for final concentrations of ~40–61 μM INF185H monomer and 44 μM drug at room temperature. For each panel in this figure, “IN” denotes “INF185H”. (C) Analytical ultracentrifugation sedimentation equilibrium analysis. Data were recorded at 12,000 RPM, at a concentration of ~10 μM INF185H, at 4°C. Linearized radial distributions are shown. The slopes are proportional to Mw at a given value of r2. Single-species plots with calculated slopes for idealized INF185H monomer, dimer, and tetramer are shown for the same rotor speed and temperature as black lines. (D) SEC-MALS analysis. The INF185H SEC trace is superimposed on each panel in the dotted red line. Retention times for molecular weight markers are shown at the top of each panel, and retention times for globular molecular weight standards are shown as open circles. Elution concentrations by refractive index approached ~0.1 mg/mL. Experiments were performed at room temperature using a Superdex 200 10/300 column. Data shown in panels B–D are provided in S1 Data.

