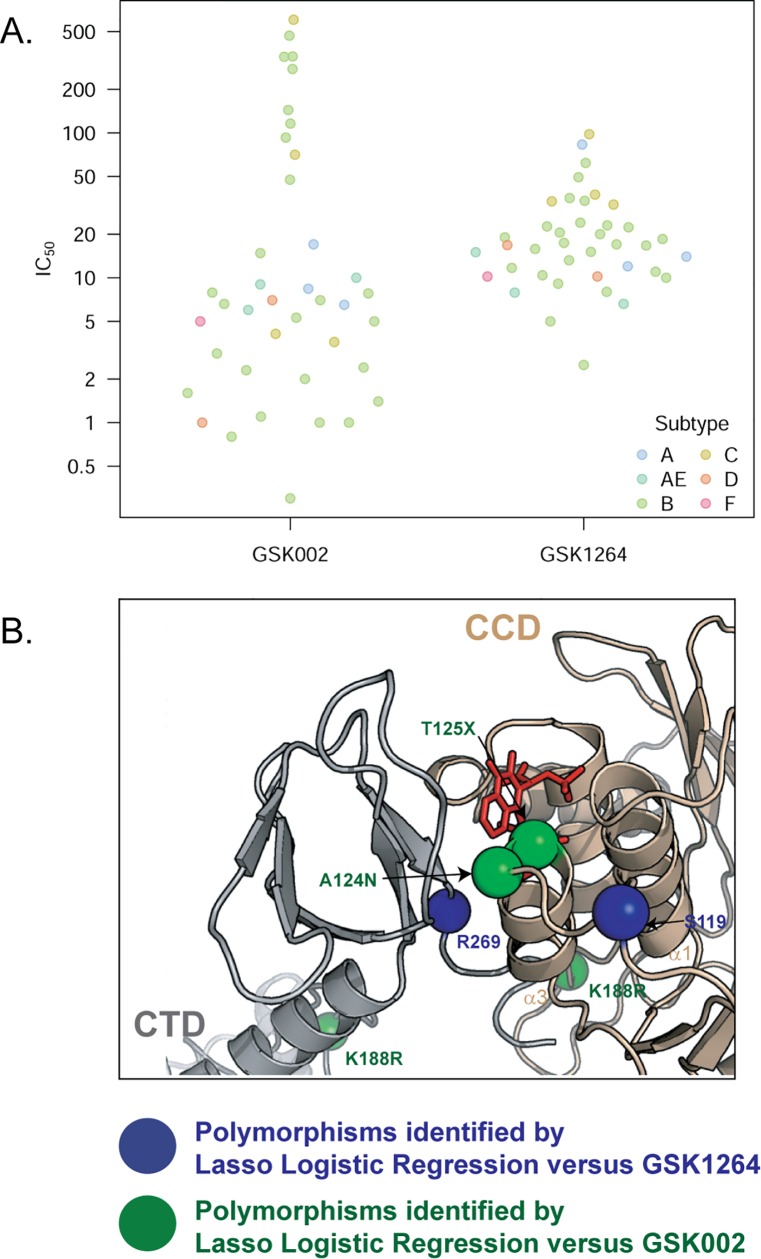
Fig 7. Sensitivity of HIV strains to GSK1264 and GSK002.
(A) Distributions of IC50 values for GSK1264 and GSK002 in infections of multiple subtypes of HIV, colored by subtype and sorted by small molecule. The y-axis shows IC50 values. Data are provided in tabular form in S1 Data. (B) Polymorphisms identified by lasso logistic regression linked to resistance to GSK1264 (blue spheres) or GSK002 (green spheres) mapped onto the IN-GSK1264 structure. GSK1264 is shown in red. See S3 Table.

