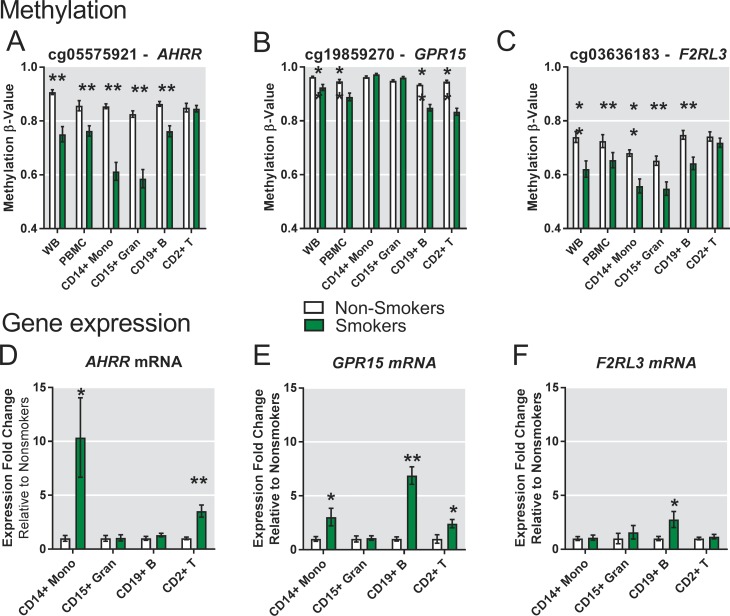
Fig 5.
Comparison of smoking-associated CpG methylation (A-C) and gene expression (D-F) differences between cell lineages. Methylation levels were measured on 450K arrays and averages for nonsmokers and smokers are displayed (A) cg05575921 (AHRR), (B) cg19859270 (GPR15) and (C) cg03636183 (F2RL3). Gene expression level (D) AHRR, (E) GPR15 and (F) F2RL3 for each cell type was measured by RT-PCR and averages are shown based on smoking status. Expression is represented by fold change difference between smokers relative to the average of nonsmokers after normalization to β-actin. Bar = Mean ± Standard Error; *p≤0.05, **p≤0.001, Student’s t-test.

