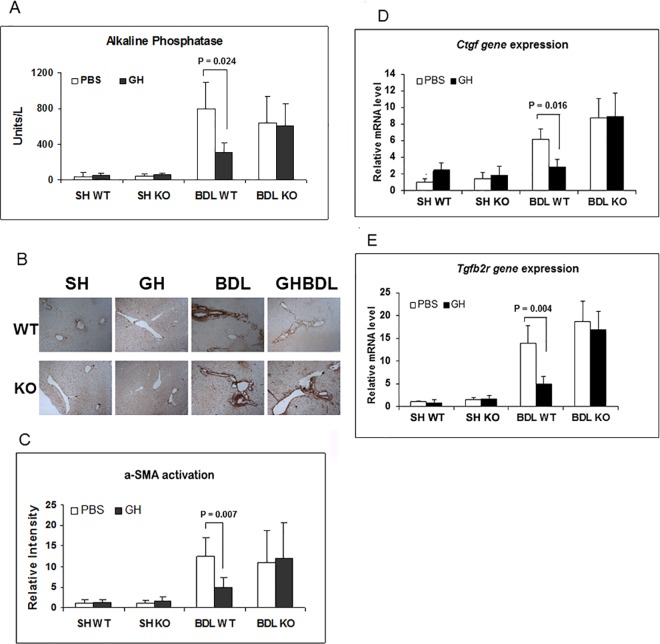
Fig 2. Hepatic cholestasis and fibrosis in WT and KO mice.
(A) Serum Alkaline Phosphatase levels (a marker of cholestasis) in SH or BDL WT and KO mice treated with PBS (□) or GH (■) and significant p values. (B) Representative micrographs of α-Sma immunostaining of SH or BDL WT and KO liver. (C) Bar graph of α-Sma immunostaining of SH or BDL WT and KO liver treated with PBS (□) or GH (■) with intensity relative to SH WT and significant p value. (D) Ctgf expression in SH or BDL WT and KO mice treated with PBS (□) or GH (■) with levels relative to Sham WT and significant p values. (E) Tgfb2R expression in SH or BDL WT and KO mice treated with PBS (□) or GH (■) with levels relative to SH WT and significant p values.

