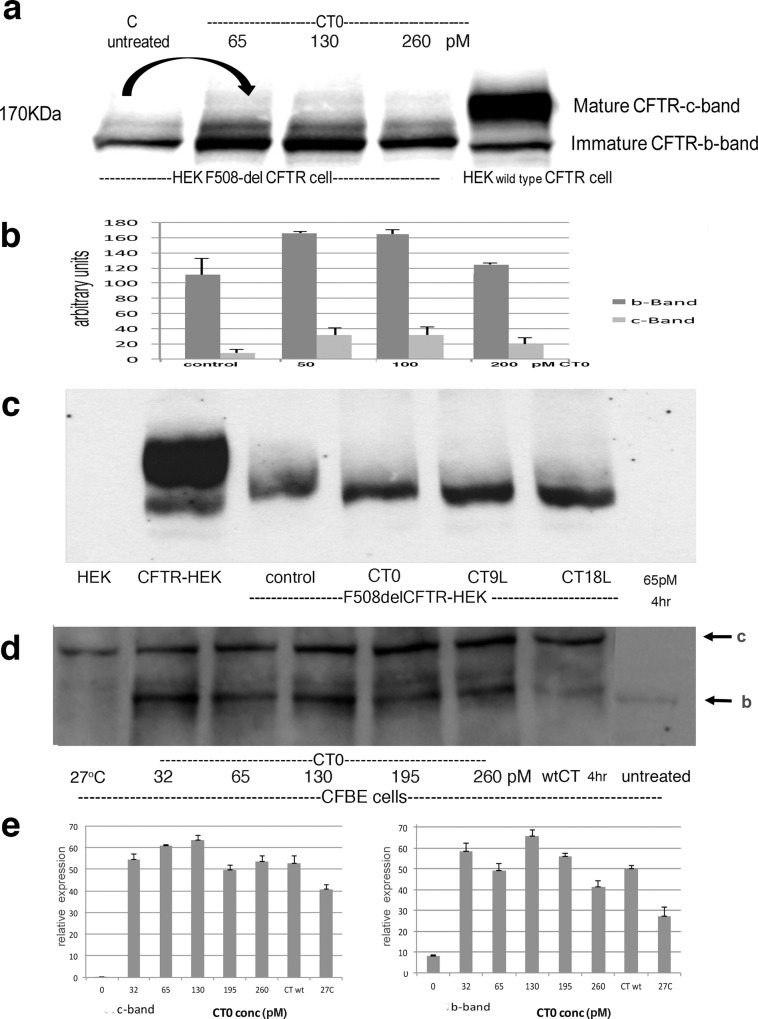
Fig 2. Catalytically inactive CT0 increases F508del CFTR Western blots were stained with anti CFTR.
a)HEK cells transfected with F508delCFTR were incubated for 4hrs ± 65- 260pM A subunit inactivated CT0; the arrow emphasizes the comparison of untreated baseline to maximal CT0 enhanced CFTR expression, b) quantitation of F508del CFTR rescue, c) F508delCFTR HEK cells were treated with 65pM CT0 containing a 9(CT9L) or 18(CT18L) leucine N-terminal A subunit extension for 4 hr, d) CFBE cell line was treated with increasing CT0 for 4hr and compared to cells rescued by 27°C culture-arrows = band c (upper) and band b, e) Quantitation of F508delCFTR increase in CFBE cells -relative scale ±SEM. Groups were compared using ANOVA followed by Tukey’s test [104].

